 |
| Fig 1-- GOES-E Water vapor image of Hurricane Tomas from 1215Z, Nov 5th, 2010 |
Now, Tomas is a tropical cyclone whereas the cyclone we looked at yesterday in Alaska was an extratropical cyclone. Is there any real difference between the two, aside from the fact that one tends to form in the tropics and the other tends to form outside the tropics? It turns out there are major structural differences between these storms. Take a look at this morning's 12 Z sounding from Jamaica, which is about the time that the satellite image above was taken. Jamaica is located to the southwest of the storm center.
 |
| Fig 2--Kingston, Jamaica sounding from 12Z, Nov 5th 2010. From the HOOT website. |
Note how in figure 2, the wind barbs switch their average direction around 200 mb. Below that level, the winds are generally out of the northwest(ish) direction, while above that they are more easterly. This is a classic pattern found in tropical cyclones (though the switch happens much lower in stronger, more organized systems). Meteorologists like to define something called the "thermal wind". The "thermal" wind really isn't a wind at all--it's the difference in winds between two different levels (wind at top minus wind at bottom). (If you prefer your thermal wind with some light jazz elevator music in the background, try watching this thermal wind YouTube video. It doesn't actually explain the features of the thermal wind I'm talking about here, but it has light jazz elevator music...). It turns out (for reasons beyond the scope of this blog for now), that when looking at the thermal wind:
The thermal wind is oriented parallel to the temperature contours with cold air to the left and warm air to the right.
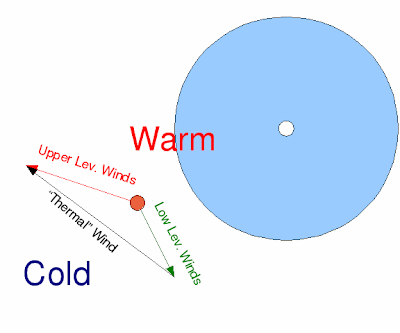
This fancy feature of the thermal wind makes it useful for diagnosing temperature structures based on winds. It's amazing how everything is connected. Here is a drawing I put together describing this relationship in the case of our Jamaica sounding:
 | |
| Fig 3--A conceptual drawing of the thermal wind relationship near a hurricane. |
In the drawing above, imagine that the big blue circle is hurricane Tomas with its little eye in the center. The orange dot represents about where Kingston, Jamaica would be in relation to the storm. I've drawn two arrows--the green arrow represents the average relative strength and direction of the lower-level winds (below that switch at 200 mb). The red arrow represents the relative strength and direction of the upper level winds (above the switch at 200 mb). This means that the black arrow is our "thermal wind", or how the wind changes from the lower levels to the upper levels. You can see that it connects the end of the low-level wind arrow with the end of the upper-level wind arrow. Remember this isn't actually a "wind", but a change of winds with height.
Now remember our adage from above--the thermal wind is parallel to temperature contours. This means that as you follow the thermal wind arrow, temperature is not going to change in that direction. However, part two of the adage says that the thermal wind is always oriented with colder air to its left and warmer air to its right. Because of this, we can label the region to the left of the thermal wind arrow as "cold" and to the right of the thermal wind arrow as "warm".
What does this mean about our hurricane? Note how the center of the hurricane is on the "warm" side of the thermal wind arrow. This implies that temperatures are warmer as you approach the center of the hurricane and cooler as you move away from the center. This is a defining characteristic of tropical cyclones--they are referred to as warm-core systems. This means that the center of the cyclone is warmer than the surrounding air. Fun fact to know.
But what about extratropical cyclones? We'll apply the same analysis tomorrow to an extratropical cyclone to see how their thermal structure works. (If you guessed that they are cold-core systems, you are on to something...)

No comments:
Post a Comment