In the synoptic setup, a large, cut-off upper-level low is rotating around in the northeastern Pacific.
 |
| Fig 1 -- GOES-W infrared satellite image from 1500Z, Dec 8, 2010. From the HOOT website. |
 |
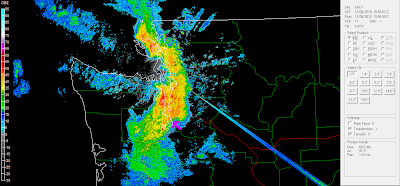
| Fig 2 -- 0.5 degree base reflectivity from KATX radar at 1556Z, Dec. 8, 2010. |
Now about 20 minutes later:
 |
| Fig 3 -- 0.5 degree base reflectivity from KATX radar at 1615Z, Dec. 8, 2010. |
 |
| Fig 4 -- 0.5 degree base velocity from KATX radar at 1615Z, Dec 8, 2010. |
Also of note in the above image are the strong inbound velocities in the southern blob of the radar returns and the strong outbound velocities in the northern blob. This is the radar sampling a jet at low-levels aloft--remember as the radar beam moves away from the radar, it tends to increase in height above the ground. So at the southern and northern parts of the domain, the radar beam is relatively high off the ground. Those high velocities like that point to a strong south-to-north jet over the area. Do we see this in analyses?
 |
| Fig 5 -- UW 12-km WRF model analysis for 12Z run of winds at the 4000 ft. level. From the UW model page. |
Another observation to look at is a meteogram from the roof of the UW Atmospheric Sciences building:
 |
| Fig 6 -- 24-hour meteogram ending at 1919Z from the roof of the UW Atmospheric Science building. From the UW NW Obs. page. |
Our front with its line of convection moved through at around 16Z, and that time immediately stands out on te right side of the meteogram. We can go through each of the variables individually. Note the wind speeds peaked with sustained winds over 20 knots and a gust measured to near 30 knots right as the leading edge came through. At the same time, the wind changed direction from being southeasterly to southwesterly. Very typical wind changes at the leading edge of a convective line.
At the same time, the temperature dropped sharply--from 54 degrees down to around 46 degrees. Some of this cooling could be due to colder air behind a cold front, but I think a lot of the cooling has to do with convective downdrafts out of this line. Warm air rising and cold air sinking provide the dynamical mechanism that gives thunderstorms their strength. Thus, in very strong thunderstorms, we'd expect a lot of sinking cold air in the downdraft region of the storm.
Now, the plot above plots relative humidity as a moisture variable instead of dewpoint temperature or something more specific. Relative humidity is a function of the temperature--so as the temperature drops, even with the same amount of moisture in the air we'd expect the relative humidity to rise (we cool closer to saturation). Therefore it's difficult to tell much from the relative humidity trace--yes, it rises sharply when the line comes through, but that's probably mostly due to the temperature falling rapidly at the same time. However, with all that rain falling, a case could be made for an increase in the ambient miosture content of the air near the surface...
Finally, we see that the pressure had been falling steadily all night until it jumped higher as the line came through and has been slowly rising since then. This further supports this line being associated with a cold front, as I've talked about in previous posts how cold fronts tend to lie in local pressure troughs. Finally, the precipitation accumulation jumped as the rain began to fall--all to be expected.
You can see from the solar radiation plot that much of the morning has been cloudy, but then there was a very sharp transition to rather clear skies once the rain stopped--lots of solar radiation suddenly reaching the surface. With all the rising motion in the convective line and behind the cold front, compensating subsidence (sinking motion) promoted an area of clear skies and sunny weather for at least part of the morning (though now more clouds seem to be moving in.
So there was a quick look at this morning's convection in Seattle. Just to confirm that there was thunder, here's Vaisala's map of the National Lightning Detection Network from this morning, showing there was indeed lightning in the Puget Sound area...a magical sight.
 |
| Fig 7 -- Lightning strikes from the NLDN for the previous two hours as of 16Z, Dec 8, 2010. From Vaisala's Public Lightning Data page. |

No comments:
Post a Comment