
I'm a part of the OLYMPEX field campaign to observe precipitation processes in complex terrain. "Why do we need to do that?" you may ask. "Haven't we observed enough precipitation in mountains? Why do it again?"
The US (NASA) and Japan (JAXA) have cooperated to launch a new weather satellite called the "Global Precipitation Mission" (GPM). This satellite has a whole suite of sophisticated instruments for observing precipitation from orbit, including both active and passive microwave sensors. Think of it as a weather radar floating around in space. We previously had another satellite carrying a radar called the "Tropical Rainfall Measuring Mission" (TRMM) which was in orbit since 1997 before finally coming to the end of its life earlier this year. As the name implies, TRMM was mostly limited to the tropics for measuring precipitation (because of its orbit). GPM will be able to sample precipitation in the mid-latitudes (e.g., the continental United States). It's still a low-earth-orbiting satellite, so it only passes overhead maybe once or twice per day. But it will be able to give us much better estimates of precipitation, particularly in areas where we don't have good radar coverage, like over the ocean or...in mountainous regions.
GPM was just launched earlier this year and we're still trying to calibrate it. Basically, we want to be sure that what the GPM sensors are telling us is actually what we're seeing in these clouds and on the ground. That's why we need this field campaign--to observe lots of details about the precipitation over mountains and see if that matches what the satellite sensors are telling us.
To do this, we've chosen to focus on the Olympic Mountains of western Washington. This is one of the wettest places in the country (particularly this time of year), so for the next two months we'll be doing an extensive observational study of every precipitation event that crosses the mountains. There are many components to this observational study including:
Lots of ground-based instruments, including rain gauges, disdrometers (to measure raindrop size), vertically-pointing radars, and standard weather instruments. We've installed these observations all over the Olympic Peninsula. This was a bit of a challenge since most of the peninsula is wilderness or the national park. A brave team of graduate students has spent the last few months hiking around installing these instruments (even having to use pack mules to carry in some of the equipment...). We'll also have several supplemental radiosonde launching groups to give us observations of the atmospheric structure aloft.

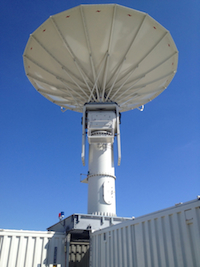
We've got several supplemental radars set up around the peninsula, including the NASA NPOL radar (below, image from NASA), a "Doppler on Wheels", and an Environment Canada X-Band radar up on the southern end of Vancouver Island. These radars will provide a continuous, 3D picture of what's going on during rain events.
And last, but not least, we'll have three research aircraft: a Citation jet, a DC8, and a NASA ER2, which is basically a U2-type spy plane converted for research purposes (seen below, image from NASA). The DC8 and Citation will mostly fly in and around precipitating clouds to sample them directly. The ER2 is equipped with the same type of radar instruments that are mounted on the GPM satellite. As I mentioned before, the GPM satellite has an orbit that only brings it overhead twice a day at best. That's not often enough for us to get a whole lot of samples in our two-month window. However, the ER2 plane will fly at over 60,000 feet (the pilot actually wears a special "space" suit to fly at such high altitudes) and "simulate" what the satellite would see if it were flying overhead. This will give us a lot of samples of what the GPM satellite instruments would see so we can make more rigorous evaluations.

This week we'll finally have the DC8 and the Citation jet around (with the ER2 arriving next week) so we'll finally start our sampling. But how do we know when and where to fly these planes and point these radars? That's where my team comes in--the forecasters.
I'm working as one of the lead forecasters to try and project when will be the best times to sample precipitation over the next 3-5 days. We're interested in sampling a lot of different phenomena, from the warm, wet atmospheric rivers to isolated, post-cold-frontal showers that are common to this area. For instance, the next four days look to be a gold mine of opportunity for the project, as we're looking to get a strong "atmospheric river" event pointing right at us, giving non-stop waves of precipitation. Here's a 12-hour precipitation forecast for this Thursday from our latest local WRF run:

The higher elevations of the Olympics are forecast to receive between 20-50mm (0.75 to 2.0 inches) of rain in just that 12 hour period. Here's the next 12 hours:

Another 75-125+mm (3-5 inches) in just that time alone! Let's look at the next 12 hours!

Another 75-100mm (3-4 inches). We're looking at over 10 inches of precipitation in the Olympics through the end of this week.
You can see in the above maps how complicated this precipitation might be to observe. There are steep gradients in the precipitation, with large amounts over the high elevations, but only light rain expected just north of Seattle. We really want to see how well the satellite instruments might be able to catch these kinds of variations.
Another concern is snow. How much of this precipitation will fall as snow as opposed to rain? Where is the melting level actually going to be? This model suggests we'll see some snow at the high elevations, upwards of 100mm (4 inches) at higher parts of the Olympics:

But how well can this model actually do at predicting precipitation type? What kinds of small-scale structures lead to one mountain getting a lot of snow, while others getting barely any? These are the kinds of questions we can try and answer over the next few months.
So that's why I've been busy...getting ready to support this campaign. I've written a new website to view the output from our local WRF model (with more modern graphics) that's located at: http://www.atmos.washington.edu/~lmadaus/olympex
We're also heavily using ensemble-based products, including the SPC SREF, UW mesoscale ensemble, and the GEFS for longer-range forecasting. It's quite the experience to take all of your collected meteorological observations and musings over the years and be forced to put it into practice every single day...
For more information on OLYMPEX, you can visit the main project website at:
Of particular interest may be the "Science Summaries" tab, where every day some of our project scientists describe the kinds of weather that we observed and what we saw.
You can also follow updates on the project's Facebook page, or on Twitter by following @UW_OLYMPEX or #OLYMPEX.
http://www.seattletimes.com/seattle-news/science/uw-nasa-deploy-scientific-blitz-to-study-rainy-olympic-peninsula/
No comments:
Post a Comment