In my last blog post I talked about the blast of arctic air that was forecast to move across the country last weekend and into this week in association with a cut-off low that would slowly creep across the southern US. Here we are on Monday and today's 500mb pattern from the ECMWF still shows that cut-off low over Texas and New Mexico.
The colder air and lift that are accompanying this storm have already contributed to snow and ice throughout New Mexico, Texas and Oklahoma. In fact, the weather map from the Oklahoma Mesonet today shows several sites that are not able to report the wind speed or direction (the red dots on the map below) because the anemometers and wind vanes are frozen!
This storm is expected to slowly chug eastward over the next few days before ramping things up along the east coast. Look again at the 500mb chart above. See that other trough in the northern Great Lakes / northwestern Ontario? That trough is forecast to merge with the cut-off low sometime during the next few days. One one hand, this means that the cut-off low will no longer be cut-off---back in the normal flow, it will accelerate and move on out of here. Before it does, though, the cold air it's bringing behind it is going to run into the warm Atlantic Ocean, and that means rain--heavy rain--for the eastern US. Here's the ECMWF forecast rainfall around 15Z Wednesday morning:
Heavy rain up and down the east coast on a day when lots and lots of people will be travelling. Not good. Fortunately by Thanksgiving day itself, it appears that the precipitation will be on its way out (as this storm accelerates off the coast). Here's the ECMWF precipitation forecast for Thursday morning at 15Z:
Only light precipitation for parts of the northeast. A lot of this near the lakes may be lake effect snow as strong northwesterly winds will occur behind this storm. See the tight gradient in the blue contours on the above map? Those are the surface pressure contours, and the tighter the pressure gradient the stronger the winds.
This brings up another question that I know many people are dying to hear the answer to--will the Macy's Thanksgiving Day parade balloons be able to float with this weather? I'm told that if the winds gust higher than 35 mph then the balloons are a no-go for the parade. So what are the models saying?
It's probably going to be close. Our models mostly forecast sustained winds, that is, the average wind speed over a certain amount of time (usually a few minutes). Wind gusts are instantaneous wind speeds, and the wind gusts can be significantly higher than the sustained winds. Here is the ECMWF sustained wind forecast over New York City for 15Z on Thursday while the parade is going on:
You can see the winds really pick up speed off the coast. But over the city itself, the bluish-greenish colors indicate winds of 15-18 knots or 17-21 mph. Again, those are the sustained winds--gusts will be higher. The GFS and NAM have slightly stronger sustained winds, getting up to more like 25-28 mph--again, with higher gusts. So, as of right now, it's going to be borderline. We'll have to watch the model runs as we get closer to get a better idea of how strong the winds are going to be.
And finally, just as a teaser for everyone out here in the Pacific Northwest, the really long range models for next Sunday-Monday have a strong cold front coming through in association with a sharp trough coming down the Pacific coast from Alaska. Here's the ECMWF 156 hour forecast (!) of 850mb heights and temperatures for next Sunday.
A blast of cold air headed our way. The ECMWF has some low-level instability following this cold front and is throwing out some convective snow showers in its wake. Though we should never, ever believe models this far out into the future, for fun here is the ECMWF snowfall accumulation forecast for next Monday morning:
Two inches of snow in the lowlands east of Everett? Eh...maybe. Don't take my word for it yet. But it's definitely something to keep an eye on...
Showing posts with label cut-off low. Show all posts
Monday, November 25, 2013
Wednesday, November 20, 2013
From calm to cold with cut-off lows
Looks like we're in for a major synoptic pattern change over the next week or so. This morning's 12Z analysis from the ECMWF model at 500mb finds us with a nice zonal (east-west) pattern. There are a few minor shortwave troughs but nothing very large in scale.
By tomorrow morning (Thursday), that is forecast to change. The weak troughing over the eastern Pacific and western US is forecast to deepen rapidly into a strong trough.
And by Friday morning, the trough has deepened to become cutoff low--completely separated from the main jet stream winds (shown by the enhanced colors on the map) that are blowing to the north.
It's pretty amazing how over the course of 48 hours the upper-level pattern can change so quickly. As I noted in previous blog posts, cut-off lows like this tend to stick around for a while. Because they are separated from the main jet stream winds, there's nothing to really force them to move along from west to east. So they usually just sit there. This low will hover around for just a few days though, before transitioning back to an open-wave trough by next Monday as seen here:
But then, yet another cut-off low is forecast to re-develop off the west coast by next Wednesday!
I should also note that this particular upper-air pattern forecast for next Wednesday is bad news for the east coast--you have a deep trough covering the northeastern quarter of the country and then another shortwave trough racing through the southeast US and about to emerge over the Gulf Stream. Nor'easter type storms are often born with this sort of setup as cyclogenesis occurs off the Carolinas. This is still a long way out in the forecasts (168 hours), but it's something to watch...
Another aspect of this cut-off low moving across the US this week into next is that it will open the door for colder air currently over Canada to sneak down into the US. Compare this morning's 12Z surface temperature analysis from the GFS:
With the forecast for Friday morning's low temperatures:
Much colder air moving in. Pretty strong front at the leading edge of it too. There are chances for some severe weather tomorrow as the front crashes through the plains, followed by a round of wintry precipitation. We're going from tornadoes this past Sunday to winter weather by the end of the week. Such is autumn...
By tomorrow morning (Thursday), that is forecast to change. The weak troughing over the eastern Pacific and western US is forecast to deepen rapidly into a strong trough.
And by Friday morning, the trough has deepened to become cutoff low--completely separated from the main jet stream winds (shown by the enhanced colors on the map) that are blowing to the north.
It's pretty amazing how over the course of 48 hours the upper-level pattern can change so quickly. As I noted in previous blog posts, cut-off lows like this tend to stick around for a while. Because they are separated from the main jet stream winds, there's nothing to really force them to move along from west to east. So they usually just sit there. This low will hover around for just a few days though, before transitioning back to an open-wave trough by next Monday as seen here:
But then, yet another cut-off low is forecast to re-develop off the west coast by next Wednesday!
I should also note that this particular upper-air pattern forecast for next Wednesday is bad news for the east coast--you have a deep trough covering the northeastern quarter of the country and then another shortwave trough racing through the southeast US and about to emerge over the Gulf Stream. Nor'easter type storms are often born with this sort of setup as cyclogenesis occurs off the Carolinas. This is still a long way out in the forecasts (168 hours), but it's something to watch...
Another aspect of this cut-off low moving across the US this week into next is that it will open the door for colder air currently over Canada to sneak down into the US. Compare this morning's 12Z surface temperature analysis from the GFS:
With the forecast for Friday morning's low temperatures:
Much colder air moving in. Pretty strong front at the leading edge of it too. There are chances for some severe weather tomorrow as the front crashes through the plains, followed by a round of wintry precipitation. We're going from tornadoes this past Sunday to winter weather by the end of the week. Such is autumn...
Thursday, September 12, 2013
Epic rainfall and flash flooding in Colorado
Rainfall over the past several days including some extraordinary rainfall last night has led to a critical situation along the Colorado Front Range today. Unfortunately the forecast for the next couple of days has more rain on the way. Let's look at what has been going on.
There has been a highly amplified upper-air pattern over the continental US over the past few days. Here's yesterday morning's 500mb analysis from the HOOT site:
You can see a large, cut-off low centered over the Great Basin region. Notice where there are lots of height lines (the black contours) close together--off in the upper Midwest and the Canadian Prairies. That's where the main jet stream is located--the strong, west-east flow that helps guide storms across the country. The jet stream is well to the north of this low--in fact, the low is comfortably tucked under a very high-amplitude ridge that goes well up into Canada and is centered over the Pacific Northwest. Here in Seattle this ridge has given us clear skies and record-breaking warmth of the past few days. Unfortunately that same ridge is keeping the steering flow away from the low over Colorado, leaving it in place.
The green colors in that analysis image show relative humidity at the 500mb level. There has been a steady stream of moisture being pulled up from the south around this low over the high plains and eastern Rockies. This moisture can also be monitored in real-time using satellite-derived water-vapor imagery, like this image from last night:
The brighter whites, purples and blues indicate lots of moisture in the upper troposphere. The CIMSS Satellite blog has an excellent loop of water vapor imagery for this event at their post here. Water vapor imagery often isn't very good for showing us the low-level moisture; what you're seeing above is mostly moisture aloft. Checking last night's sounding from Denver we can see that there was far more moisture in the lower levels of the atmosphere:
The dewpoint and temperature profiles are almost right on top of each other from the surface up to around 600mb--that's a very deep layer for the atmosphere to be saturated. A lot of people have been commenting on how unusually moist this is for Colorado. One way we estimate the amount of water vapor throughout the entire depth of the atmosphere is through a measure called Precipitable Water (PWAT). This basically says that if all of the water vapor in the air above your head were to immediately condense into liquid water and fall down as rain, this is how much rain would fall. On the sounding above, in the lower right corner you'll see the PWAT value calculated as 33.16 mm. That's 1.3 inches of precipitable water. For comparison, here is a climatology of the average precipitable water values in Denver throughout the year from the NWS Rapid City page:
You can see in September that the average precipitable water (the 50th percentile) is only about 0.55 in. Where does 1.3 inches fall? Above the maximum value (1.25 in.) for September! An extraordinary amount of moisture.
Another thing you'll note on the sounding above is that near-surface winds are out of the southeast. This promotes upslope flow--easterly winds forced to rise when they meet the mountains. This constant rising motion in very moist air produces continuous condensation, clouds and rain. You can see how steady the rainfall was last night in looking at this timeseries of observations from the NCAR Foothills lab on the northeast side of Boulder.
The rain gauge reset itself to zero this morning (hence the big drop in precip down to zero again), but you can see that over just last evening over 6 in. of rain had fallen. In one evening. The rainfall was also quite steady over this entire period--no big spurts or jumps in the precipitation that you'd expect if this was due to strong convection. In fact, not much lightning was reported with this rain (though there was some). There have been several reports of particular locations in the foothills getting over 8" of rain so far. This also shows an interesting feature of this event. Remember our precipitable water above? It was only 1.3 inches. If that was the total precipitable water, how could we be getting 6-8 inches of rain? Remember that there is that stream of moisture constantly being brought up on the south--we saw it on the water vapor imagery. This keeps replenishing the water vapor in the atmosphere, bringing in more and more moisture as the current moisture rains out. Still--too get the much rain with these precipitable water values, these clouds have been very efficient at their rain production.
The rainfall overnight consisted of broad areas of stratiform precipitation in some locations, but also (particularly near Boulder) a series of more intense precipitation cells, probably somewhat convective, that repeatedly formed east of town and then moved west over the foothills. Here's an example radar image from last night:
So what are the consequences of so much water over such a short period of time? Flash flooding. Here's the stream gauge data for Boulder Creek at Broadway in downtown Boulder:
There were extreme rises in the stream level overnight. You'll note that the typical river stage is only a little over 1 foot. From 6 PM Wednesday through about 3 AM MDT, the creek rose rapidly to just over 7 feet--moderate flood stage. There was a drop off early this morning as the rain eased a bit, but more rain is developing today and you can see the stream flow on the rise again. Basically all of the canyons along the northern Front Range hit at least minor flood stage last night and into today. Here's the gauge data for St. Vrain Creek near Lyons--approaching record levels. There was also a dam failure last night upstream from Lyons, prompting extensive evacuations.
There continue to be problems with managing this massive amount of water. Pretty much every road going into the mountains is closed due to flooding or mudslides at this time. Many streets in Boulder itself are impassible due to high water. There are evacuations underway in the Big Thompson River canyon (the location of an infamous flood in 1976--which had distinctly different meteorological origin, being due to a parked convective storm as opposed to widespread, more stratiform rain).
Unfortunately it doesn't look like it's time to take a breath just yet. The rain died down a little overnight, but it's forecast to pick up again today. We're already seeing that throughout the region. Here's the latest High-Resolution Rapid Refresh model's forecast for total accumulated precipitation through tonight.
It's predicting another 1-2 inches over the northern Front Range. It's also alarming to note the 3-5 inch accumulations suggested for the mountains behind Colorado Springs and Pueblo, suggesting an additional flash flooding threat further south.
There has been a highly amplified upper-air pattern over the continental US over the past few days. Here's yesterday morning's 500mb analysis from the HOOT site:
The green colors in that analysis image show relative humidity at the 500mb level. There has been a steady stream of moisture being pulled up from the south around this low over the high plains and eastern Rockies. This moisture can also be monitored in real-time using satellite-derived water-vapor imagery, like this image from last night:
The brighter whites, purples and blues indicate lots of moisture in the upper troposphere. The CIMSS Satellite blog has an excellent loop of water vapor imagery for this event at their post here. Water vapor imagery often isn't very good for showing us the low-level moisture; what you're seeing above is mostly moisture aloft. Checking last night's sounding from Denver we can see that there was far more moisture in the lower levels of the atmosphere:
The dewpoint and temperature profiles are almost right on top of each other from the surface up to around 600mb--that's a very deep layer for the atmosphere to be saturated. A lot of people have been commenting on how unusually moist this is for Colorado. One way we estimate the amount of water vapor throughout the entire depth of the atmosphere is through a measure called Precipitable Water (PWAT). This basically says that if all of the water vapor in the air above your head were to immediately condense into liquid water and fall down as rain, this is how much rain would fall. On the sounding above, in the lower right corner you'll see the PWAT value calculated as 33.16 mm. That's 1.3 inches of precipitable water. For comparison, here is a climatology of the average precipitable water values in Denver throughout the year from the NWS Rapid City page:
You can see in September that the average precipitable water (the 50th percentile) is only about 0.55 in. Where does 1.3 inches fall? Above the maximum value (1.25 in.) for September! An extraordinary amount of moisture.
Another thing you'll note on the sounding above is that near-surface winds are out of the southeast. This promotes upslope flow--easterly winds forced to rise when they meet the mountains. This constant rising motion in very moist air produces continuous condensation, clouds and rain. You can see how steady the rainfall was last night in looking at this timeseries of observations from the NCAR Foothills lab on the northeast side of Boulder.
The rain gauge reset itself to zero this morning (hence the big drop in precip down to zero again), but you can see that over just last evening over 6 in. of rain had fallen. In one evening. The rainfall was also quite steady over this entire period--no big spurts or jumps in the precipitation that you'd expect if this was due to strong convection. In fact, not much lightning was reported with this rain (though there was some). There have been several reports of particular locations in the foothills getting over 8" of rain so far. This also shows an interesting feature of this event. Remember our precipitable water above? It was only 1.3 inches. If that was the total precipitable water, how could we be getting 6-8 inches of rain? Remember that there is that stream of moisture constantly being brought up on the south--we saw it on the water vapor imagery. This keeps replenishing the water vapor in the atmosphere, bringing in more and more moisture as the current moisture rains out. Still--too get the much rain with these precipitable water values, these clouds have been very efficient at their rain production.
The rainfall overnight consisted of broad areas of stratiform precipitation in some locations, but also (particularly near Boulder) a series of more intense precipitation cells, probably somewhat convective, that repeatedly formed east of town and then moved west over the foothills. Here's an example radar image from last night:
So what are the consequences of so much water over such a short period of time? Flash flooding. Here's the stream gauge data for Boulder Creek at Broadway in downtown Boulder:
There were extreme rises in the stream level overnight. You'll note that the typical river stage is only a little over 1 foot. From 6 PM Wednesday through about 3 AM MDT, the creek rose rapidly to just over 7 feet--moderate flood stage. There was a drop off early this morning as the rain eased a bit, but more rain is developing today and you can see the stream flow on the rise again. Basically all of the canyons along the northern Front Range hit at least minor flood stage last night and into today. Here's the gauge data for St. Vrain Creek near Lyons--approaching record levels. There was also a dam failure last night upstream from Lyons, prompting extensive evacuations.
There continue to be problems with managing this massive amount of water. Pretty much every road going into the mountains is closed due to flooding or mudslides at this time. Many streets in Boulder itself are impassible due to high water. There are evacuations underway in the Big Thompson River canyon (the location of an infamous flood in 1976--which had distinctly different meteorological origin, being due to a parked convective storm as opposed to widespread, more stratiform rain).
Unfortunately it doesn't look like it's time to take a breath just yet. The rain died down a little overnight, but it's forecast to pick up again today. We're already seeing that throughout the region. Here's the latest High-Resolution Rapid Refresh model's forecast for total accumulated precipitation through tonight.
It's predicting another 1-2 inches over the northern Front Range. It's also alarming to note the 3-5 inch accumulations suggested for the mountains behind Colorado Springs and Pueblo, suggesting an additional flash flooding threat further south.
Thursday, January 26, 2012
A slow-moving storm and looking toward the weekend
It's been a while since I last posted on the blog as we've scrambled to recover from last week's winter weather here in Seattle. I had a grand total of four inches of snow at my place, topped with a quarter inch of freezing rain, topped by another two inches of snow. All in all, a pretty good storm--enough to close down the university for a few days. However now we're returning to more seasonable weather--periods of rain with highs in the 40s.
A different kind of storm has been slowly making its way across the southern US these past few days. Here's this morning's radar mosaic over the southeast:
A line of strong storms with some very heavy rain is moving across the area. This is really the same line that moved across east Texas and western Louisiana yesterday, spawning a few tornadoes in the process. Here is a map of the Storm Prediction Center storm reports from yesterday. The red dots indicate tornado reports and the blue dots indicate severe wind reports.
I've been surprised at how slow-moving this storm has been, particularly since organized lines of storms like that tend to move eastward pretty quickly. However, the upper-level structure shows that this surface low is being supported by a cut-off low aloft. Here's yesterday morning's 300mb analysis:
And here's this morning's 300mb analysis:
Not a whole lot of change. The center of the cut-off low at 300mb has moved east from west Texas to more over central Texas, but that's about it. We call this a "cut-off" low because it's basically cut off from the main jet stream. Note the strong jet streaks across the northwest and the northeast, but the 300mb low is well south of that stream. Without those strong winds moving through, cut-off lows tend to move more slowly and stay around for a while.
Interestingly enough, the upper-level forcing from this trough really isn't communicating all that well with the surface. Here's this morning's GFS surface analysis:
There is no strong surface low analyzed over the southeast--just a diffuse area of lower pressure along a baroclinic zone (a zone where there is a strong temperature gradient). Cool (but not particularly cold) continental air is somewhat organizing behind this baroclinic zone as a cold front, and as this air encounters warm, moist air brought up from the Gulf of Mexico, we're seeing storms.
This storm looks to slowly lift northeast over the next 24 hours. Here's the GFS forecast surface map for tomorrow morning:
The cut-off low aloft is actually forecast to begin folding back into the main flow today and, as that brings the surface low north, the surface low will begin interacting with that strong jet streak over the northeast that we saw in the 300mb map above. This extra support aloft looks to deepen the low and really sharpen that cold front.
There are some other interesting mountain-driven features on this forecast surface map as well. Notice the big, sprawling high-pressure area centered over Washington state. With clockwise (anti-cyclonic) flow around that high, you can see that it's bringing winds from the northwest to southeast over the Rockies in Montana, Wyoming and into Colorado, and it's also bringing winds that are trying to come from the east over the Cascades and Coastal Ranges in California. In both cases the air is descending from high mountains down to either the lower Great Plains or out to the Pacific Ocean. When air descends down mountain ranges, it tends to warm up (sometimes rather significantly) and that lowers its pressure. You can see that, as a result of this, there's a trough of lower pressure extending down the east side of the Rockies (or, rather, over the northern and central plains) and also an inverted trough of lower pressure extending up the coast of California. See how there is that series of upward bulges in the pressure contours along the west coast? That's areas of lower pressure within the larger sprawling high pressure. This is still considered a trough--an area of lower pressure--even though it's not pointed in the direction we normally expect a trough to be. You'll sometimes see this phenomenon (particularly on the west coast) referred to as a thermal trough.
Anyhow, moving ahead in the forecast, on Friday evening a quick Alberta-clipper type low is forecast to move through the upper midwest, bringing a shot of snow. Here's Saturday morning's forecast surface map:
Behind this low is colder air, but not frigid--here you can see temperatures only forecast to be in the teens and low 20s for much of the upper midwest. Certainly cold, but not extremely so. Much colder air is pooling to the north in central Canada, but longer-range forecasts keep that cold air to the north throughout the weekend.
A different kind of storm has been slowly making its way across the southern US these past few days. Here's this morning's radar mosaic over the southeast:
A line of strong storms with some very heavy rain is moving across the area. This is really the same line that moved across east Texas and western Louisiana yesterday, spawning a few tornadoes in the process. Here is a map of the Storm Prediction Center storm reports from yesterday. The red dots indicate tornado reports and the blue dots indicate severe wind reports.
I've been surprised at how slow-moving this storm has been, particularly since organized lines of storms like that tend to move eastward pretty quickly. However, the upper-level structure shows that this surface low is being supported by a cut-off low aloft. Here's yesterday morning's 300mb analysis:
And here's this morning's 300mb analysis:
Not a whole lot of change. The center of the cut-off low at 300mb has moved east from west Texas to more over central Texas, but that's about it. We call this a "cut-off" low because it's basically cut off from the main jet stream. Note the strong jet streaks across the northwest and the northeast, but the 300mb low is well south of that stream. Without those strong winds moving through, cut-off lows tend to move more slowly and stay around for a while.
Interestingly enough, the upper-level forcing from this trough really isn't communicating all that well with the surface. Here's this morning's GFS surface analysis:
There is no strong surface low analyzed over the southeast--just a diffuse area of lower pressure along a baroclinic zone (a zone where there is a strong temperature gradient). Cool (but not particularly cold) continental air is somewhat organizing behind this baroclinic zone as a cold front, and as this air encounters warm, moist air brought up from the Gulf of Mexico, we're seeing storms.
This storm looks to slowly lift northeast over the next 24 hours. Here's the GFS forecast surface map for tomorrow morning:
The cut-off low aloft is actually forecast to begin folding back into the main flow today and, as that brings the surface low north, the surface low will begin interacting with that strong jet streak over the northeast that we saw in the 300mb map above. This extra support aloft looks to deepen the low and really sharpen that cold front.
There are some other interesting mountain-driven features on this forecast surface map as well. Notice the big, sprawling high-pressure area centered over Washington state. With clockwise (anti-cyclonic) flow around that high, you can see that it's bringing winds from the northwest to southeast over the Rockies in Montana, Wyoming and into Colorado, and it's also bringing winds that are trying to come from the east over the Cascades and Coastal Ranges in California. In both cases the air is descending from high mountains down to either the lower Great Plains or out to the Pacific Ocean. When air descends down mountain ranges, it tends to warm up (sometimes rather significantly) and that lowers its pressure. You can see that, as a result of this, there's a trough of lower pressure extending down the east side of the Rockies (or, rather, over the northern and central plains) and also an inverted trough of lower pressure extending up the coast of California. See how there is that series of upward bulges in the pressure contours along the west coast? That's areas of lower pressure within the larger sprawling high pressure. This is still considered a trough--an area of lower pressure--even though it's not pointed in the direction we normally expect a trough to be. You'll sometimes see this phenomenon (particularly on the west coast) referred to as a thermal trough.
Anyhow, moving ahead in the forecast, on Friday evening a quick Alberta-clipper type low is forecast to move through the upper midwest, bringing a shot of snow. Here's Saturday morning's forecast surface map:
Behind this low is colder air, but not frigid--here you can see temperatures only forecast to be in the teens and low 20s for much of the upper midwest. Certainly cold, but not extremely so. Much colder air is pooling to the north in central Canada, but longer-range forecasts keep that cold air to the north throughout the weekend.
Monday, January 9, 2012
Relief for Texas, cool weather ahead
A cut-off low over the desert southwest is slowly churning eastward through Texas and into the deep South. In response to the low-level cyclonic motion generated by this low, southerly winds have helped pull lots of moist air out from over the Gulf of Mexico and into Texas. The result? Heavy rains today throughout much of the state.
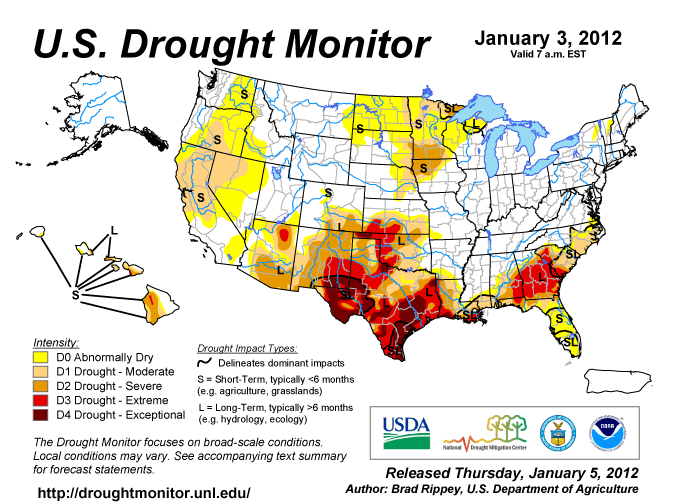
According to the Houston forecast office, they're expecting 1-3" on average for most of their forecast area with locally heavier amounts up to 5" today. That's a lot of rain, particularly for an area that still is in a large precipitation deficit. Here's the latest national drought monitor image (from January 3rd, released January 5th):
Much of Texas, particularly south Texas, and parts of Oklahoma are still in "extreme" to "exceptional" drought. Hopefully today's rains will help alleviate some of that...
Let's look at how the upper-air pattern is going to change over the next few days. Here's the current 500mb picture from this morning's GFS analysis:
You can see the cut-off low centered over the El Paso area. By Wednesday morning, the low is forecast to have move eastward across the deep South.
However, notice that there's a shortwave trough that's beginning to dig in from up in Canada. In this 48-hour forecast the trough is centered over southern Manitoba back through Eastern Montana. This trough is forecast to deepen pretty significantly over the following 48 hours. The little cut-off low in the south is forecast to move up the east coast, helping to bring in warm air from out over the Gulf Stream. As the shortwave trough digging in from Canada in the above image moves eastward, it's going to encounter the rather strong baroclinic zone (warm-cold temperature gradient) left behind by the little cut-off low over the east coast. Remember that upper-level winds are strengthened by strong horizontal temperature gradients below. As such, that shortwave trough really starts getting strong by Friday morning:
This could mean some pretty crazy weather in the northeast on Thursday and Friday of this week. We'll have to keep an eye on that.
But notice what is happening to the overall upper-air pattern--a strong ridge is building over the west coast, while large-scale troughing is occurring over most of the US east of the Rockies. This would be considered the longwave pattern, as opposed to the shortwaves we usually talk about. Shortwaves are the smaller troughs embedded in the bigger, longwave pattern. Here the longwave pattern has shifted to ridging over the east Pacific and troughing over the central US. This is actually a very typical La Nina type of upper-air pattern.
And if we're getting into a typical La Nina type pattern, all of those long-term weather predictions about the type of winter to expect should start coming into line. The pattern is forecast to become even more established by Saturday:
Still a big ridge in the eastern Pacific with troughing over the eastern US. Notice the location of the jet stream--down the Rockies and then out eastward over Texas and the south. Since the winds aloft are connected to temperature gradients below, the jet stream often marks the boundary between cold, arctic air to the north and warmer, subtropical air to the south. With this large-scale troughing in place, we can anticipate much cooler temperatures across much of the central US by the end of the week. Here's the forecast 1000-500mb thicknesses (a proxy for temperature throughout the lower atmosphere) on Saturday morning:
Anywhere north of the solid blue line is usually cold enough to support snow. You can see that everywhere except for the southern-most tier of states is in the snow regime. We're talking high temperatures in the teens and 20s for parts of the northern US by the end of the week. Looks like winter is going to happen this year after all.
According to the Houston forecast office, they're expecting 1-3" on average for most of their forecast area with locally heavier amounts up to 5" today. That's a lot of rain, particularly for an area that still is in a large precipitation deficit. Here's the latest national drought monitor image (from January 3rd, released January 5th):
Much of Texas, particularly south Texas, and parts of Oklahoma are still in "extreme" to "exceptional" drought. Hopefully today's rains will help alleviate some of that...
Let's look at how the upper-air pattern is going to change over the next few days. Here's the current 500mb picture from this morning's GFS analysis:
You can see the cut-off low centered over the El Paso area. By Wednesday morning, the low is forecast to have move eastward across the deep South.
However, notice that there's a shortwave trough that's beginning to dig in from up in Canada. In this 48-hour forecast the trough is centered over southern Manitoba back through Eastern Montana. This trough is forecast to deepen pretty significantly over the following 48 hours. The little cut-off low in the south is forecast to move up the east coast, helping to bring in warm air from out over the Gulf Stream. As the shortwave trough digging in from Canada in the above image moves eastward, it's going to encounter the rather strong baroclinic zone (warm-cold temperature gradient) left behind by the little cut-off low over the east coast. Remember that upper-level winds are strengthened by strong horizontal temperature gradients below. As such, that shortwave trough really starts getting strong by Friday morning:
This could mean some pretty crazy weather in the northeast on Thursday and Friday of this week. We'll have to keep an eye on that.
But notice what is happening to the overall upper-air pattern--a strong ridge is building over the west coast, while large-scale troughing is occurring over most of the US east of the Rockies. This would be considered the longwave pattern, as opposed to the shortwaves we usually talk about. Shortwaves are the smaller troughs embedded in the bigger, longwave pattern. Here the longwave pattern has shifted to ridging over the east Pacific and troughing over the central US. This is actually a very typical La Nina type of upper-air pattern.
And if we're getting into a typical La Nina type pattern, all of those long-term weather predictions about the type of winter to expect should start coming into line. The pattern is forecast to become even more established by Saturday:
Still a big ridge in the eastern Pacific with troughing over the eastern US. Notice the location of the jet stream--down the Rockies and then out eastward over Texas and the south. Since the winds aloft are connected to temperature gradients below, the jet stream often marks the boundary between cold, arctic air to the north and warmer, subtropical air to the south. With this large-scale troughing in place, we can anticipate much cooler temperatures across much of the central US by the end of the week. Here's the forecast 1000-500mb thicknesses (a proxy for temperature throughout the lower atmosphere) on Saturday morning:
Anywhere north of the solid blue line is usually cold enough to support snow. You can see that everywhere except for the southern-most tier of states is in the snow regime. We're talking high temperatures in the teens and 20s for parts of the northern US by the end of the week. Looks like winter is going to happen this year after all.
Wednesday, December 7, 2011
A little cut-off low in the central Pacific
I've noticed over the past few days that there's been a curious dry spot in the central Pacific water vapor imagery. It starts at around 8Z on Monday. You can see the development of a structure sometimes loosely referred to as a "baroclinic leaf" in the area I've circled. This often marks the initial formation of a surface low pressure center. Notice the strong gradient between drier air (the yellow and brown colors) and more moist air (the whites, blues and greens). Drier air tends to be sinking while the moist air tends to be rising.
By late Monday evening, however, the pocket of dry air became nearly circular and somewhat surrounded by the stream of moist air that had originally been flowing to its east.
And it has remained there for the past 48 hours or so, continuing on into this morning.
A loop of the past 72 hours of water vapor imagery (which includes a jump when NOAA changed the satellite that gives us these images from GOES-11 to GOES-15) can be found at:
http://www.atmos.washington.edu/~ovens/loops/wxloop.cgi?wv_common+/72h/
In that loop, you can see the full evolution of this dry spot.
A glance at the surface map (from our WRF-GFS model analysis this morning) shows no apparent surface low, though there is a trough of lower pressure at the surface in the vicinity. In the map below, the dry spot is located in the area between the two high pressure centers--one off the coast of the Pacific Northwest and the other in the central Pacific.
So this is not a feature that means much for the surface. However, looking at the 500mb chart we do indeed see a little cut-off low analyzed in the location of that dry spot. Overlaid on the image in color is the relative humidity at 500mb. Red indicates high relative humidity (very moist air) whereas blue indicates low relative humidity (very dry air). I personally would have reversed the color scale, but it is what it is. Anyhow, you can see that in the center of the 500mb low, it is indeed very dry. There is also an area of more moisture shown just to the east and south of the low center, and on this morning's water vapor imagery we also see the same thing.
While this whole feature may not really mean much in the way of our day-to-day weather, I find if kind of fascinating how we can get a little cut-off low like this that just kind of gets "forgotten" by the main flow for several days. Originally it looked like this would spin up a rather decent cyclone. However, the jet stream moved north and left this little pocket of low heights spinning around for the past few days. It looks like the strong front to the north (seen by the band of higher water vapor to the north and the strong temperature gradient on the surface map) is moving south and east, and our little low will probably become absorbed in that over the next few days.
By late Monday evening, however, the pocket of dry air became nearly circular and somewhat surrounded by the stream of moist air that had originally been flowing to its east.
And it has remained there for the past 48 hours or so, continuing on into this morning.
![]() |
http://www.atmos.washington.edu/~ovens/loops/wxloop.cgi?wv_common+/72h/
In that loop, you can see the full evolution of this dry spot.
A glance at the surface map (from our WRF-GFS model analysis this morning) shows no apparent surface low, though there is a trough of lower pressure at the surface in the vicinity. In the map below, the dry spot is located in the area between the two high pressure centers--one off the coast of the Pacific Northwest and the other in the central Pacific.
So this is not a feature that means much for the surface. However, looking at the 500mb chart we do indeed see a little cut-off low analyzed in the location of that dry spot. Overlaid on the image in color is the relative humidity at 500mb. Red indicates high relative humidity (very moist air) whereas blue indicates low relative humidity (very dry air). I personally would have reversed the color scale, but it is what it is. Anyhow, you can see that in the center of the 500mb low, it is indeed very dry. There is also an area of more moisture shown just to the east and south of the low center, and on this morning's water vapor imagery we also see the same thing.
While this whole feature may not really mean much in the way of our day-to-day weather, I find if kind of fascinating how we can get a little cut-off low like this that just kind of gets "forgotten" by the main flow for several days. Originally it looked like this would spin up a rather decent cyclone. However, the jet stream moved north and left this little pocket of low heights spinning around for the past few days. It looks like the strong front to the north (seen by the band of higher water vapor to the north and the strong temperature gradient on the surface map) is moving south and east, and our little low will probably become absorbed in that over the next few days.
Subscribe to:
Posts (Atom)


