After the eastern Pacific got off to an early, rapid start with its tropical storm season (which isn't unexpected in an El Nino year), we're looking at our first tropical storm developing in the western Gulf of Mexico in the next 12 hours. On satellite, this storm has been getting its act together:
And the National Hurricane Center thinks we'll likely see Tropical Storm Bill by tonight. This storm is forecast to run out of ocean really fast, though, and hit the Gulf coast of Texas tonight and tomorrow. From Weather Underground, here are the recent 18Z GFS ensemble forecasts for the track of this cyclone over the next several days.
You can see that there's pretty high agreement that the storm will cross central Texas before curving north through Oklahoma then back northeastward across Missouri and Illinois and into the midwest and mid-Atlantic states. Of course, almost as soon as this storm hits land in Texas it will stop being a tropical cyclone and turn into an extratropical cyclone. Though this means weaker winds, the storm will still bring a lot of moisture into the heart of the country. Here's an animation of the satellite-derived total precipitable water in the atmosphere over the last five days. You can see towards the end of the animation that the developing storm in the western Gulf of Mexico (with its characteristic spiraling motion) is bringing in lots of moisture towards the Texas coast.
That moisture will move inland over the next several days. Here's the 18Z NAM forecast precipitable water for tomorrow afternoon (from HOOT):
Lots of moisture over Texas and Oklahoma, with residual moisture from the current frontal zone across the Ohio River Valley. Looking ahead to Wednesday afternoon there is still a lot of moisture forecast over eastern Texas and Oklahoma.
And even by Thursday afternoon, east Texas is still looking at a ton of moisture, though we're also seeing a lot of liquid move north into Arkansas and Missouri.
Not unsurprisingly, the Weather Prediction Center (NOAA/WPC) is forecasting some intense rainfall amounts over the next three days, with a swath over 6 inches from Texas into Oklahoma and western Arkansas, and over 3 inches from Missouri into central and southern Illinois.
It's interesting to note that, despite this storm being a tropical cyclone, its ability to influence the larger-scale synoptic pattern is somewhat limited. Notice how the storm path follows a nice, sweeping curve around the southeastern United States. Why is that? Because we have a relatively modest ridge of high pressure/high heights sitting over the southeastern US, as seen in this 24-hour 500mb height forecast from the NAM:
Though that ridge looks so weak (it only has a single height contour!), there's actually still more potential energy sitting in that ridge than kinetic energy in a tropical cyclone. So, even though it seems to be a strong storm to us, our tropical storm is still a slave to the synoptic pattern, and that "weak" ridge over the southeast will "shield" that area from most of the effects of this storm.
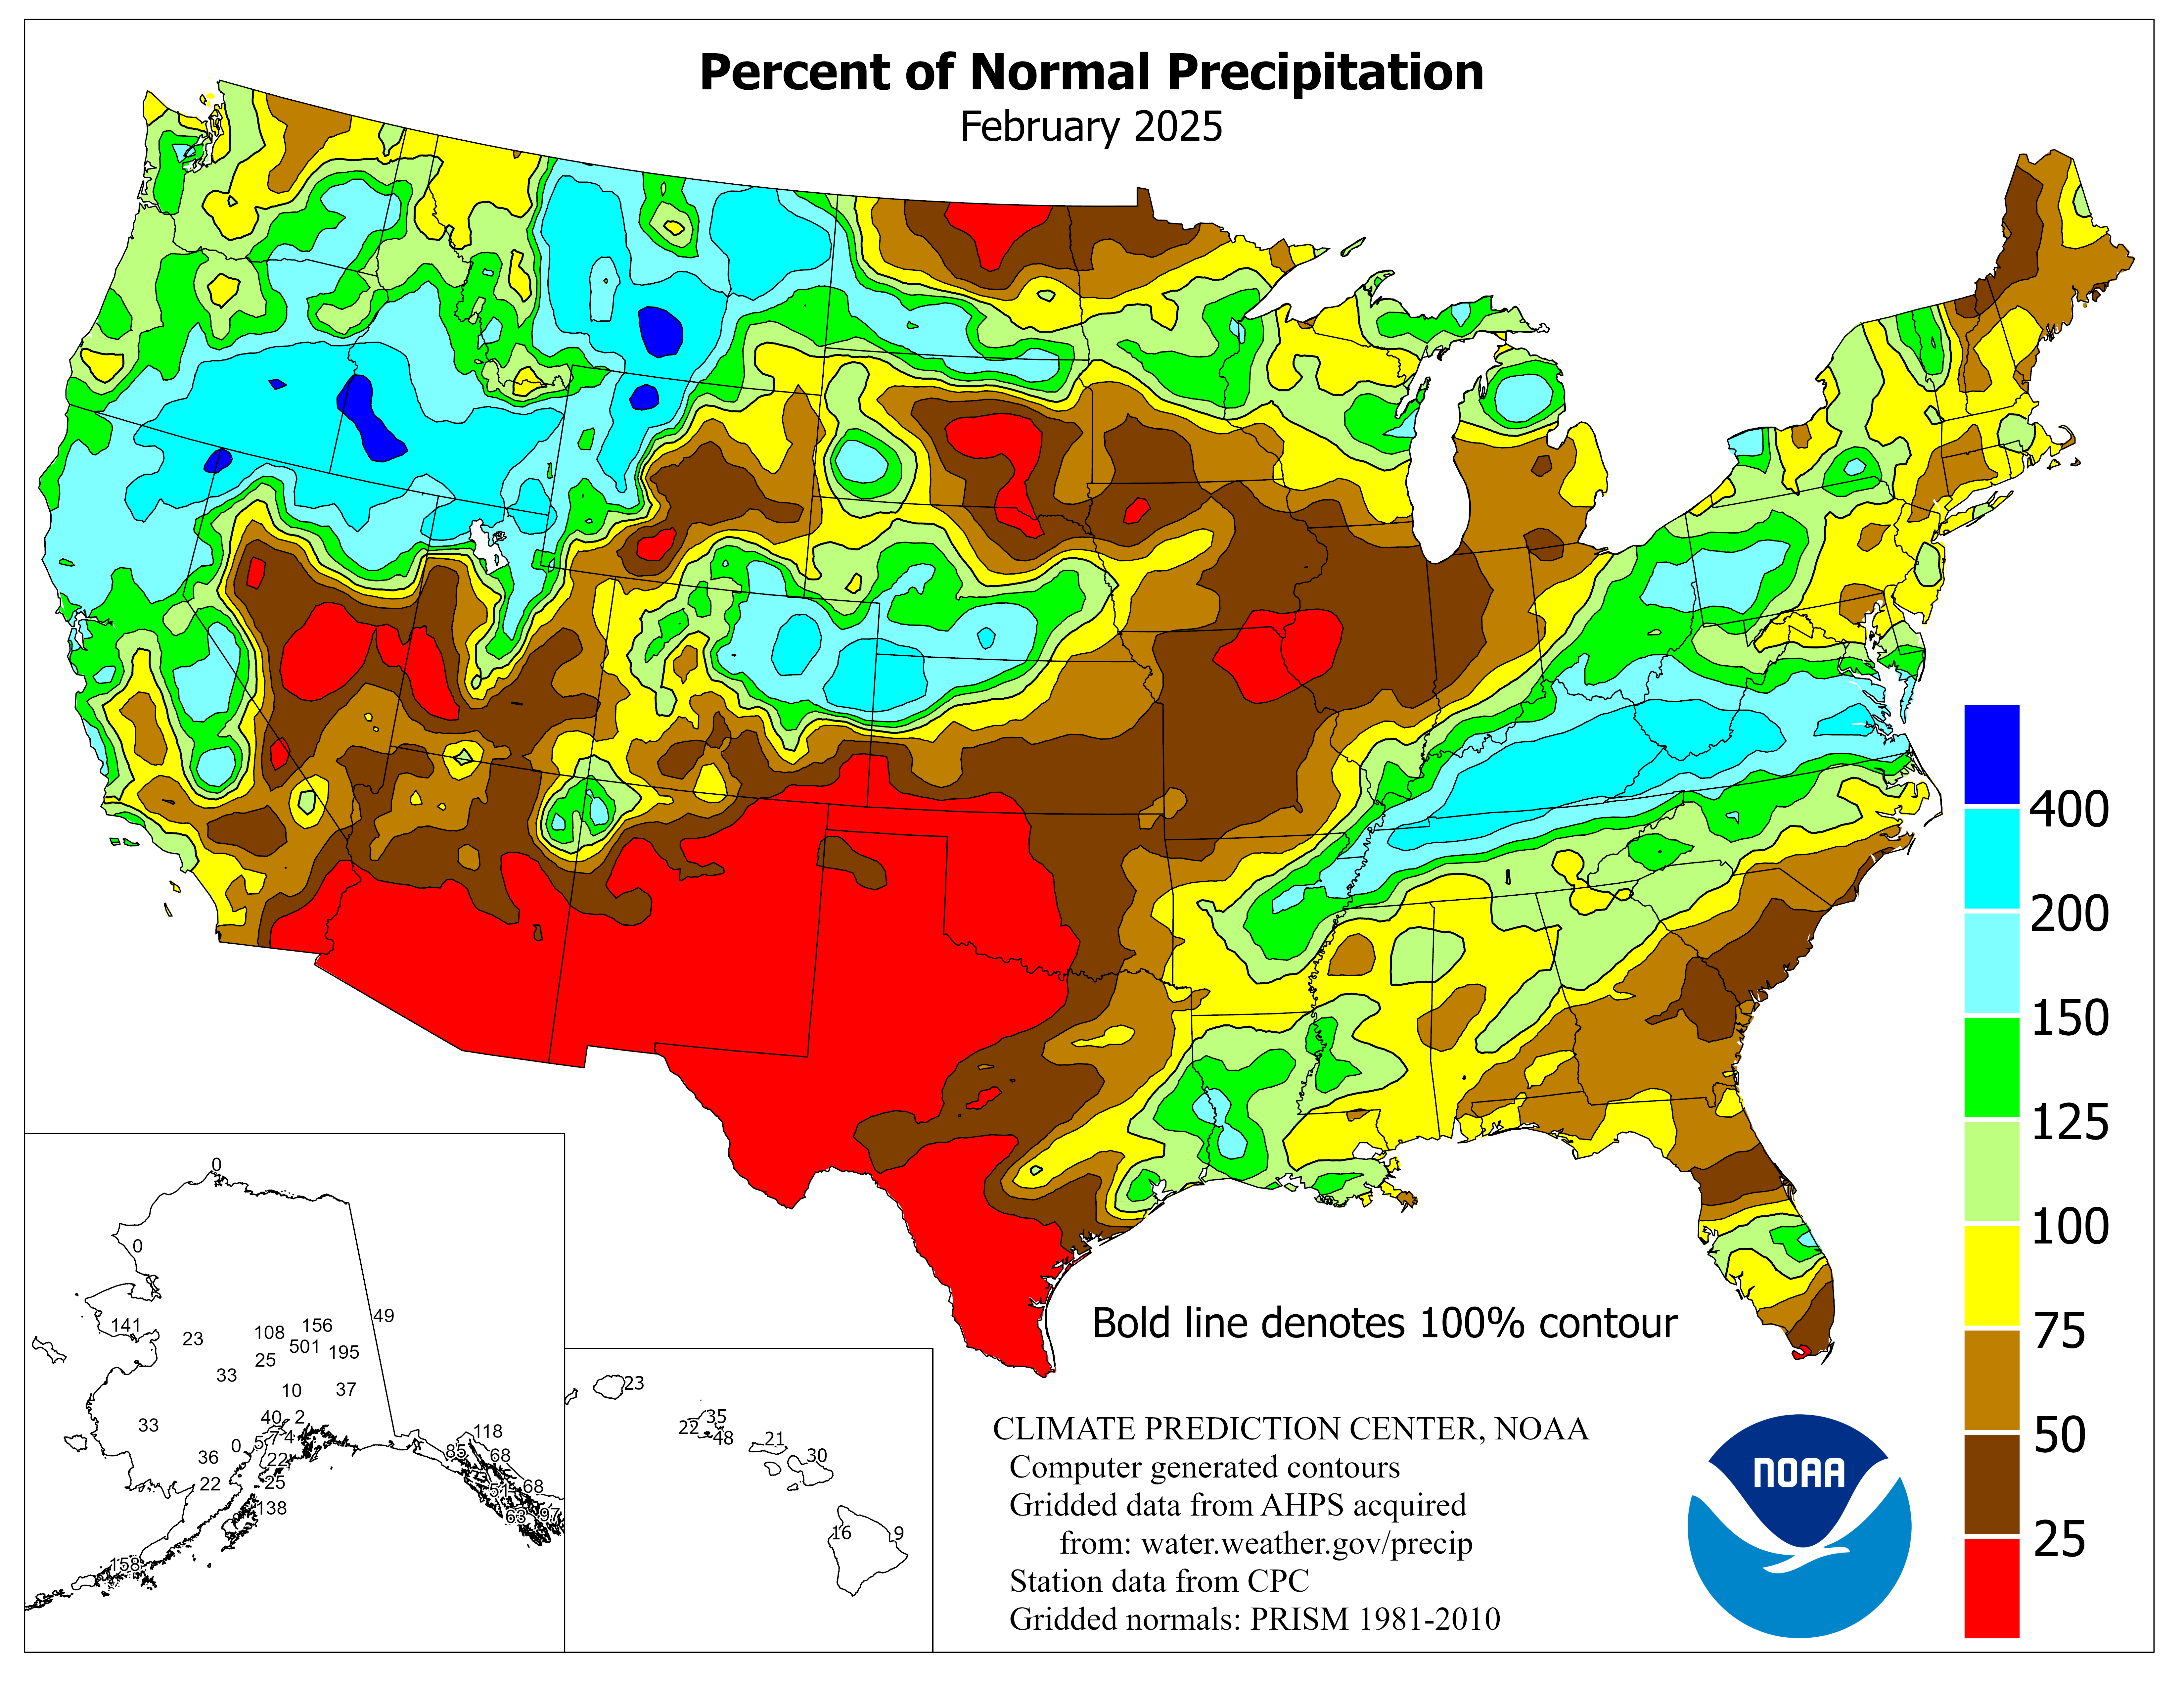
Unfortunately, it's that same ridge that is directing the storm over areas that really don't need any more rain right now. Here's a map of the percentage of normal precipitation during this May. Much of Oklahoma and Texas received 200-500% of their normal precipitation for May.
Soils in that area are also saturated. Here's a map of soil moisture percentiles as of the end of May. Much of eastern Texas and southern Oklahoma is in the 99th percentile for soil moisture...that is, soils likely contain nearly record amounts of moisture for this time of year.
Add on top of this the fact that several major rivers throughout that corridor (and also into Missouri and Illinois) are currently at flood stage from all the rain we've already gotten recently (the orange and red dots on this map)...
And you have a recipe for a flooding disaster across a large swath of the central US. Flood watches are already up for most of eastern Texas and eastern Oklahoma, with hydrologic outlooks suggesting at future flood watches going up throughout Arkansas, Missouri, Illinois and Indiana as well. If you live in these areas, you need to be paying attention to the weather this week and be alert for possible flooding. This is going to be the weather story of the week.
Showing posts with label floods. Show all posts
Monday, June 15, 2015
Tuesday, May 12, 2015
The high desert gets soaked, but not as bad as Oklahoma
After days and days of high-precipitation thunderstorms with embedded tornadoes and large hail, Oklahoma is finally getting a bit of a break. Just how wet was it there?
The Oklahoma Mesonet recently published rainfall totals for the past two weeks. Here's what it looked like:
Huge rainfall totals across the state. Over 12 inches in some locations in only 2 weeks. The annual percentage of normal rainfall has spiked through the roof. So far through the roof, in fact, that it's maxing out the colorbar on the Oklahoma Climate Survey plot, with most places greater than 180% of their total rainfall.
Needless to say, the latest monthly outlook from the Climate Prediction Center has drought conditions in Oklahoma and Texas "improving" over the next month...
But drought persists elsewhere---California is seeking no help and the persistent troughing has kept most of the heavy rain-makers to the south of the upper midwest, causing drought conditions to develop in Minnesota and the Dakotas.
Eastern Washington and Oregon have also been running a bit low on their precipitation and are in "drought" conditions as well. A warmer-than-average winter has allowed the western side of the Cascades to see about normal precipitation, but without much snowfall accumulating in the mountains. This is bad news for the eastern sides of the states, where they don't see as much precipitation, but rely on meltout from the snowpack to supply them with water for agriculture.
Here's a plot showing the snow water equivalent normals and what we've had this year at Stampede Pass, which is in the Cascades southeast of Seattle.
The light blue line is the normal Snow Water Equivalent, or the mass of water in the snowpack. The dark blue is this year. You can see that by this time of year we should be just dropping down from our peak snow in mid April, but this year we're already at zero snow. Looking at a map of percentage of average snowpack as of last week, we can see pretty much everyone is basically melted out (or at least below 25% of where they should be).
But there is some hope for the eastern side of the mountains! An upper-level low is churning its way through Oregon at this time. It's moving slowly and a bit further south than usual, and this is allowing a fair amount of moisture to get to the eastern sides of the Cascades. Here's the latest water vapor satellite image.
We can see the swirl of the low with its attendant moisture streaming up through Nevada and into Idaho. That low is forecast to slowly lift north-northeastward over the next couple of days. With cold air underneath that trough, we're expecting some destabilization and a few rounds of thunderstorms to develop. All of this in an area that does not get much rain to begin with. Eastern Washington and Oregon are basically deserts; here's a map (from the PRISM group) of annual average precipitation across Oregon. Much of the high desert east of the Cascades sees 10-15 inches or less of rainfall per year.
Here's a similar map for Washington, with the same story away from the higher terrain:
Our middle- to long-range forecasts are calling for several inches of rain by the end of the week east of the Cascades. This is an unusual setup. Here's the total rainfall accumulation by Friday evening from this morning's local WRF model run.
Large swaths of area getting 1-3 inches of rainfall. Great for farmers! It may seem like these numbers are small in comparison to Oklahoma, but keep in mind that these are places that are lucky to get a tenth of an inch of rain with a good convective shower. There are usually a few thunderstorms that occur throughout the year that will give a more thorough soaking; this will be one of those periods.
The Oklahoma Mesonet recently published rainfall totals for the past two weeks. Here's what it looked like:
Huge rainfall totals across the state. Over 12 inches in some locations in only 2 weeks. The annual percentage of normal rainfall has spiked through the roof. So far through the roof, in fact, that it's maxing out the colorbar on the Oklahoma Climate Survey plot, with most places greater than 180% of their total rainfall.
Needless to say, the latest monthly outlook from the Climate Prediction Center has drought conditions in Oklahoma and Texas "improving" over the next month...
But drought persists elsewhere---California is seeking no help and the persistent troughing has kept most of the heavy rain-makers to the south of the upper midwest, causing drought conditions to develop in Minnesota and the Dakotas.
Eastern Washington and Oregon have also been running a bit low on their precipitation and are in "drought" conditions as well. A warmer-than-average winter has allowed the western side of the Cascades to see about normal precipitation, but without much snowfall accumulating in the mountains. This is bad news for the eastern sides of the states, where they don't see as much precipitation, but rely on meltout from the snowpack to supply them with water for agriculture.
Here's a plot showing the snow water equivalent normals and what we've had this year at Stampede Pass, which is in the Cascades southeast of Seattle.
The light blue line is the normal Snow Water Equivalent, or the mass of water in the snowpack. The dark blue is this year. You can see that by this time of year we should be just dropping down from our peak snow in mid April, but this year we're already at zero snow. Looking at a map of percentage of average snowpack as of last week, we can see pretty much everyone is basically melted out (or at least below 25% of where they should be).
But there is some hope for the eastern side of the mountains! An upper-level low is churning its way through Oregon at this time. It's moving slowly and a bit further south than usual, and this is allowing a fair amount of moisture to get to the eastern sides of the Cascades. Here's the latest water vapor satellite image.
We can see the swirl of the low with its attendant moisture streaming up through Nevada and into Idaho. That low is forecast to slowly lift north-northeastward over the next couple of days. With cold air underneath that trough, we're expecting some destabilization and a few rounds of thunderstorms to develop. All of this in an area that does not get much rain to begin with. Eastern Washington and Oregon are basically deserts; here's a map (from the PRISM group) of annual average precipitation across Oregon. Much of the high desert east of the Cascades sees 10-15 inches or less of rainfall per year.
Here's a similar map for Washington, with the same story away from the higher terrain:
Our middle- to long-range forecasts are calling for several inches of rain by the end of the week east of the Cascades. This is an unusual setup. Here's the total rainfall accumulation by Friday evening from this morning's local WRF model run.
Large swaths of area getting 1-3 inches of rainfall. Great for farmers! It may seem like these numbers are small in comparison to Oklahoma, but keep in mind that these are places that are lucky to get a tenth of an inch of rain with a good convective shower. There are usually a few thunderstorms that occur throughout the year that will give a more thorough soaking; this will be one of those periods.
Sunday, February 8, 2015
More snow doesn't mean more liquid
Keeping on the theme from the other week, I wanted to look at the snowfall to date this year in Chicago and Boston given their recent near-record snowfall. Fortunately the National Weather Service in Chicago makes it easy with their year-to-date climate plots. Here's the most recent one from O'Hare Airport (KORD) in Chicago.
In the top panel you're seeing the daily temperature ranges as the dark blue bars, then in the background are the normal daily range (light green) stretching out to record highs (the light red) and record lows (light blue). While bouncing around a bit, the temperatures in Chicago actually have been pretty near normal overall, with cold spells in early January and early February and a warm spell in mid-late January. The next plot down is the precipitation so far this year in inches and the plot below that is the snowfall so far in inches. The yellow lines in both plots are the "normal" precipitation up to that point in the year. Now, precipitation doesn't smoothly fall in even amounts every day, so we never expect the actual precipitation to look like that. Instead, it tends to follow a stair-step pattern, jumping every time there's a big event. Anywhere you see dark green, the precipitation at that point was greater than the normal for the year at that time.
Here's what's interesting about the plots above. You can see in the bottom panel that the total snowfall since January 1st is at 33.8 inches--almost 250% of normal. The big snowstorm of January 31-February 2 shows up quite starkly as the abrupt jump in the snowfall. But what about the actual liquid precipitation? In the panel above, you can see that this is still right about normal: we've had 2.44 inches so far this year. So, despite having extreme snow depth amounts, the actual liquid content of that snow wasn't anything to go on about. It must have been extremely fluffy snow.
In fact, you can estimate the snow ratio from the last event. Looks like the total gain in snowfall was 20 inches of snow (~14 inches to 33.8 inches) but the gain in precipitation was only about 1 inch (adding up the daily observations). So the snow ratio was around 20:1---twice as big as the commonly-assumed 10:1 snow ratio we use as a ballpark figure.
The Boston forecast office doesn't seem to have nice plots like the one I showed above (in fact, most of the climatology data on the website seems to not have been updated since 2002 or, in some cases, since 1995 (!)). From the climate data, though, in January KBOS had 34.4 inches of snow (compared to a normal of 12.9 inches). For liquid precipitation, they had 3.57 inches compared to a normal of 3.36 inches. So, despite having over 250% of the normal snowfall, there was only slightly more liquid equivalent than normal. The snow ratios were lower--about 10:1--but that seems to be more usual for Boston. Regardless, incredible snow depth totals doesn't mean incredible snow liquid totals. Thinking down the line, this means that when the spring melt-out time comes, these heavy snowfalls don't portend any unusual flooding...
In fact, the January precipitation was near normal for most of the areas hit hard by snow, according to the Climate Prediction Center.
In the top panel you're seeing the daily temperature ranges as the dark blue bars, then in the background are the normal daily range (light green) stretching out to record highs (the light red) and record lows (light blue). While bouncing around a bit, the temperatures in Chicago actually have been pretty near normal overall, with cold spells in early January and early February and a warm spell in mid-late January. The next plot down is the precipitation so far this year in inches and the plot below that is the snowfall so far in inches. The yellow lines in both plots are the "normal" precipitation up to that point in the year. Now, precipitation doesn't smoothly fall in even amounts every day, so we never expect the actual precipitation to look like that. Instead, it tends to follow a stair-step pattern, jumping every time there's a big event. Anywhere you see dark green, the precipitation at that point was greater than the normal for the year at that time.
Here's what's interesting about the plots above. You can see in the bottom panel that the total snowfall since January 1st is at 33.8 inches--almost 250% of normal. The big snowstorm of January 31-February 2 shows up quite starkly as the abrupt jump in the snowfall. But what about the actual liquid precipitation? In the panel above, you can see that this is still right about normal: we've had 2.44 inches so far this year. So, despite having extreme snow depth amounts, the actual liquid content of that snow wasn't anything to go on about. It must have been extremely fluffy snow.
In fact, you can estimate the snow ratio from the last event. Looks like the total gain in snowfall was 20 inches of snow (~14 inches to 33.8 inches) but the gain in precipitation was only about 1 inch (adding up the daily observations). So the snow ratio was around 20:1---twice as big as the commonly-assumed 10:1 snow ratio we use as a ballpark figure.
The Boston forecast office doesn't seem to have nice plots like the one I showed above (in fact, most of the climatology data on the website seems to not have been updated since 2002 or, in some cases, since 1995 (!)). From the climate data, though, in January KBOS had 34.4 inches of snow (compared to a normal of 12.9 inches). For liquid precipitation, they had 3.57 inches compared to a normal of 3.36 inches. So, despite having over 250% of the normal snowfall, there was only slightly more liquid equivalent than normal. The snow ratios were lower--about 10:1--but that seems to be more usual for Boston. Regardless, incredible snow depth totals doesn't mean incredible snow liquid totals. Thinking down the line, this means that when the spring melt-out time comes, these heavy snowfalls don't portend any unusual flooding...
In fact, the January precipitation was near normal for most of the areas hit hard by snow, according to the Climate Prediction Center.
The two areas that stand out, though, are the continued drought in much of the western US (particularly California) and the wetter-than-normal conditions in Arizona through west Texas that were caused by a few cut-off lows that brought a lot of moisture to that region. The effects of these anomalies will be watched in the coming months.
Monday, September 16, 2013
Converting the Flooding Colorado Rain to Snow
The rainfall totals coming out of Colorado over the week have been incredible--upwards of 15" in many places. One common comparison to "put this into perspective" that I've seen a lot of on TV, online and social media is converting these rainfall totals to equivalent snow depth. In another blog post, I talked about computing snow ratios--the ratio of snow depth to liquid water precipitation. One common snow ratio we use for quick, back-of-the-envelope calculations is 10:1--10 inches of snow for every 1 inch of liquid water precipitation. Thus I've seen a lot of people commenting that the 15" of rain they saw in Boulder would have been 12.5 feet of snow (150")! While that sounds incredible, could that really happen? Had this event happened in winter, would this storm really have produced 10 feet of snow in Boulder?
It's extremely unlikely. There are many factors working against such an event. First, let's start by looking at the tremendous amounts of moisture associated with this storm. In my last blog, I talked about how the precipitable water (PWAT) associated with this storm is the highest ever observed in the month of September over Denver. Here's the annual climatology of average precipitable water values, with the PWAT observed on Thursday evening highlighted. You can see it was at the maximum observed PWAT value for September.
But what about PWAT values during the winter? Notice that in December through February, the PWAT values on average are only about 0.25 inches with all-time maxima around 0.5-0.6 inches. We're currently just about 200% of the normal PWAT for September, so even with the same anomaly in winter that would still work out to be only 0.5 inches. Certainly a lot for winter, but less than half of the current PWAT.
So why are the PWAT values so much lower in the winter? Remember that as the temperatures get lower, so do the saturation vapor pressures for water vapor in air. This means that, by mass, at colder temperatures far less water vapor can be present in air before it starts condensing out. We often describe this as the air not being able to "hold" as much water at lower temperatures. You've felt this--even with the relative humidity at 80% on both a hot day and a cold day, the hot day feels far muggier than the cold day. There's just more water vapor present when the air is warmer. For snow, we want the temperatures through a good depth of the lower atmosphere to be below freezing, putting more limits on just how high the PWAT values can go. It's just too cold to have this much water.
Another thing to consider is the matter of what is called precipitation efficiency. One distinguishing feature of the rain that has been affecting Colorado is that it has had a high precipitation efficiency. What does precipitation efficiency mean? It's basically the ratio of how much water is raining out of a storm to how much water is being brought into a storm through advection and evaporation. If the precipiation efficiency (PE) is 100%, then as much rain is falling out of a storm as is entering it. If PE is at 0%, then the storm is growing--the cloud is getting bigger--but no precipitation is falling out of it. PE can theoretically go all the way up to infinite, for a storm that is raining but no longer has any inflow. Here's a figure from Market et al (2003) showing these different PEs:
These storms in Colorado have had a very high precipitation efficiency--probably close to 100%. We've had 12+" of rain over 36 hour periods or so in many places with precipitable water values staying very steady around 1.2-1.3 inches over the same period of time. To get so many inches of rain with these PWAT values the storms have to be very efficient. One rule of thumb to estimate precipitation efficiency (Scofield et al 2000 and Market et al 2003) is to multiply the average relative humidity from the surface to 500mb by the total precipitable water. Well, let's look at our Denver sounding from Wednesday evening:
Our dewpoint and temperature are virtually identical up to ~600mb and pretty close above that (aside...we drop below freezing at that point so we have to consider relative humidity with respect to ice...)...so we are more or less saturated (at 100% relative humidity) all the way up through 500 mb. With precipitable water around 1.3 inches, the rule of thumb would suggest precipitation efficiency of 130%--probably a bit of an overestimate, but still--very efficient.
This high efficiency is typical of warm rain processes--storms where the rain spends little to no time frozen. Throw in cold processes--including ice and snow--and efficiency tends to drop. There are a lot of microphysical reasons why this is so, but snowing just is not as efficient of a process. A study by Hindman et al. (1981) (cited in the Market study mentioned above) showed that for mountain winter storms, typical precipitation efficiencies average between 7%-49%. Much less efficient than warm rain storms.
So, in summary, if it were cold enough to snow we wouldn't have nearly as much water vapor as this week's Colorado rain storms have had. And even if we did have anomalously high water vapor to work with, ice and snow precipitation does not occur nearly as efficiently as warm rain precipitation. We wouldn't be able to capitalize on this moisture. Unfortunately for Colorado, all this rain had to be rain...
It's extremely unlikely. There are many factors working against such an event. First, let's start by looking at the tremendous amounts of moisture associated with this storm. In my last blog, I talked about how the precipitable water (PWAT) associated with this storm is the highest ever observed in the month of September over Denver. Here's the annual climatology of average precipitable water values, with the PWAT observed on Thursday evening highlighted. You can see it was at the maximum observed PWAT value for September.
But what about PWAT values during the winter? Notice that in December through February, the PWAT values on average are only about 0.25 inches with all-time maxima around 0.5-0.6 inches. We're currently just about 200% of the normal PWAT for September, so even with the same anomaly in winter that would still work out to be only 0.5 inches. Certainly a lot for winter, but less than half of the current PWAT.
So why are the PWAT values so much lower in the winter? Remember that as the temperatures get lower, so do the saturation vapor pressures for water vapor in air. This means that, by mass, at colder temperatures far less water vapor can be present in air before it starts condensing out. We often describe this as the air not being able to "hold" as much water at lower temperatures. You've felt this--even with the relative humidity at 80% on both a hot day and a cold day, the hot day feels far muggier than the cold day. There's just more water vapor present when the air is warmer. For snow, we want the temperatures through a good depth of the lower atmosphere to be below freezing, putting more limits on just how high the PWAT values can go. It's just too cold to have this much water.
Another thing to consider is the matter of what is called precipitation efficiency. One distinguishing feature of the rain that has been affecting Colorado is that it has had a high precipitation efficiency. What does precipitation efficiency mean? It's basically the ratio of how much water is raining out of a storm to how much water is being brought into a storm through advection and evaporation. If the precipiation efficiency (PE) is 100%, then as much rain is falling out of a storm as is entering it. If PE is at 0%, then the storm is growing--the cloud is getting bigger--but no precipitation is falling out of it. PE can theoretically go all the way up to infinite, for a storm that is raining but no longer has any inflow. Here's a figure from Market et al (2003) showing these different PEs:
These storms in Colorado have had a very high precipitation efficiency--probably close to 100%. We've had 12+" of rain over 36 hour periods or so in many places with precipitable water values staying very steady around 1.2-1.3 inches over the same period of time. To get so many inches of rain with these PWAT values the storms have to be very efficient. One rule of thumb to estimate precipitation efficiency (Scofield et al 2000 and Market et al 2003) is to multiply the average relative humidity from the surface to 500mb by the total precipitable water. Well, let's look at our Denver sounding from Wednesday evening:
Our dewpoint and temperature are virtually identical up to ~600mb and pretty close above that (aside...we drop below freezing at that point so we have to consider relative humidity with respect to ice...)...so we are more or less saturated (at 100% relative humidity) all the way up through 500 mb. With precipitable water around 1.3 inches, the rule of thumb would suggest precipitation efficiency of 130%--probably a bit of an overestimate, but still--very efficient.
This high efficiency is typical of warm rain processes--storms where the rain spends little to no time frozen. Throw in cold processes--including ice and snow--and efficiency tends to drop. There are a lot of microphysical reasons why this is so, but snowing just is not as efficient of a process. A study by Hindman et al. (1981) (cited in the Market study mentioned above) showed that for mountain winter storms, typical precipitation efficiencies average between 7%-49%. Much less efficient than warm rain storms.
So, in summary, if it were cold enough to snow we wouldn't have nearly as much water vapor as this week's Colorado rain storms have had. And even if we did have anomalously high water vapor to work with, ice and snow precipitation does not occur nearly as efficiently as warm rain precipitation. We wouldn't be able to capitalize on this moisture. Unfortunately for Colorado, all this rain had to be rain...
Thursday, September 12, 2013
Epic rainfall and flash flooding in Colorado
Rainfall over the past several days including some extraordinary rainfall last night has led to a critical situation along the Colorado Front Range today. Unfortunately the forecast for the next couple of days has more rain on the way. Let's look at what has been going on.
There has been a highly amplified upper-air pattern over the continental US over the past few days. Here's yesterday morning's 500mb analysis from the HOOT site:
You can see a large, cut-off low centered over the Great Basin region. Notice where there are lots of height lines (the black contours) close together--off in the upper Midwest and the Canadian Prairies. That's where the main jet stream is located--the strong, west-east flow that helps guide storms across the country. The jet stream is well to the north of this low--in fact, the low is comfortably tucked under a very high-amplitude ridge that goes well up into Canada and is centered over the Pacific Northwest. Here in Seattle this ridge has given us clear skies and record-breaking warmth of the past few days. Unfortunately that same ridge is keeping the steering flow away from the low over Colorado, leaving it in place.
The green colors in that analysis image show relative humidity at the 500mb level. There has been a steady stream of moisture being pulled up from the south around this low over the high plains and eastern Rockies. This moisture can also be monitored in real-time using satellite-derived water-vapor imagery, like this image from last night:
The brighter whites, purples and blues indicate lots of moisture in the upper troposphere. The CIMSS Satellite blog has an excellent loop of water vapor imagery for this event at their post here. Water vapor imagery often isn't very good for showing us the low-level moisture; what you're seeing above is mostly moisture aloft. Checking last night's sounding from Denver we can see that there was far more moisture in the lower levels of the atmosphere:
The dewpoint and temperature profiles are almost right on top of each other from the surface up to around 600mb--that's a very deep layer for the atmosphere to be saturated. A lot of people have been commenting on how unusually moist this is for Colorado. One way we estimate the amount of water vapor throughout the entire depth of the atmosphere is through a measure called Precipitable Water (PWAT). This basically says that if all of the water vapor in the air above your head were to immediately condense into liquid water and fall down as rain, this is how much rain would fall. On the sounding above, in the lower right corner you'll see the PWAT value calculated as 33.16 mm. That's 1.3 inches of precipitable water. For comparison, here is a climatology of the average precipitable water values in Denver throughout the year from the NWS Rapid City page:
You can see in September that the average precipitable water (the 50th percentile) is only about 0.55 in. Where does 1.3 inches fall? Above the maximum value (1.25 in.) for September! An extraordinary amount of moisture.
Another thing you'll note on the sounding above is that near-surface winds are out of the southeast. This promotes upslope flow--easterly winds forced to rise when they meet the mountains. This constant rising motion in very moist air produces continuous condensation, clouds and rain. You can see how steady the rainfall was last night in looking at this timeseries of observations from the NCAR Foothills lab on the northeast side of Boulder.
The rain gauge reset itself to zero this morning (hence the big drop in precip down to zero again), but you can see that over just last evening over 6 in. of rain had fallen. In one evening. The rainfall was also quite steady over this entire period--no big spurts or jumps in the precipitation that you'd expect if this was due to strong convection. In fact, not much lightning was reported with this rain (though there was some). There have been several reports of particular locations in the foothills getting over 8" of rain so far. This also shows an interesting feature of this event. Remember our precipitable water above? It was only 1.3 inches. If that was the total precipitable water, how could we be getting 6-8 inches of rain? Remember that there is that stream of moisture constantly being brought up on the south--we saw it on the water vapor imagery. This keeps replenishing the water vapor in the atmosphere, bringing in more and more moisture as the current moisture rains out. Still--too get the much rain with these precipitable water values, these clouds have been very efficient at their rain production.
The rainfall overnight consisted of broad areas of stratiform precipitation in some locations, but also (particularly near Boulder) a series of more intense precipitation cells, probably somewhat convective, that repeatedly formed east of town and then moved west over the foothills. Here's an example radar image from last night:
So what are the consequences of so much water over such a short period of time? Flash flooding. Here's the stream gauge data for Boulder Creek at Broadway in downtown Boulder:
There were extreme rises in the stream level overnight. You'll note that the typical river stage is only a little over 1 foot. From 6 PM Wednesday through about 3 AM MDT, the creek rose rapidly to just over 7 feet--moderate flood stage. There was a drop off early this morning as the rain eased a bit, but more rain is developing today and you can see the stream flow on the rise again. Basically all of the canyons along the northern Front Range hit at least minor flood stage last night and into today. Here's the gauge data for St. Vrain Creek near Lyons--approaching record levels. There was also a dam failure last night upstream from Lyons, prompting extensive evacuations.
There continue to be problems with managing this massive amount of water. Pretty much every road going into the mountains is closed due to flooding or mudslides at this time. Many streets in Boulder itself are impassible due to high water. There are evacuations underway in the Big Thompson River canyon (the location of an infamous flood in 1976--which had distinctly different meteorological origin, being due to a parked convective storm as opposed to widespread, more stratiform rain).
Unfortunately it doesn't look like it's time to take a breath just yet. The rain died down a little overnight, but it's forecast to pick up again today. We're already seeing that throughout the region. Here's the latest High-Resolution Rapid Refresh model's forecast for total accumulated precipitation through tonight.
It's predicting another 1-2 inches over the northern Front Range. It's also alarming to note the 3-5 inch accumulations suggested for the mountains behind Colorado Springs and Pueblo, suggesting an additional flash flooding threat further south.
There has been a highly amplified upper-air pattern over the continental US over the past few days. Here's yesterday morning's 500mb analysis from the HOOT site:
The green colors in that analysis image show relative humidity at the 500mb level. There has been a steady stream of moisture being pulled up from the south around this low over the high plains and eastern Rockies. This moisture can also be monitored in real-time using satellite-derived water-vapor imagery, like this image from last night:
The brighter whites, purples and blues indicate lots of moisture in the upper troposphere. The CIMSS Satellite blog has an excellent loop of water vapor imagery for this event at their post here. Water vapor imagery often isn't very good for showing us the low-level moisture; what you're seeing above is mostly moisture aloft. Checking last night's sounding from Denver we can see that there was far more moisture in the lower levels of the atmosphere:
The dewpoint and temperature profiles are almost right on top of each other from the surface up to around 600mb--that's a very deep layer for the atmosphere to be saturated. A lot of people have been commenting on how unusually moist this is for Colorado. One way we estimate the amount of water vapor throughout the entire depth of the atmosphere is through a measure called Precipitable Water (PWAT). This basically says that if all of the water vapor in the air above your head were to immediately condense into liquid water and fall down as rain, this is how much rain would fall. On the sounding above, in the lower right corner you'll see the PWAT value calculated as 33.16 mm. That's 1.3 inches of precipitable water. For comparison, here is a climatology of the average precipitable water values in Denver throughout the year from the NWS Rapid City page:
You can see in September that the average precipitable water (the 50th percentile) is only about 0.55 in. Where does 1.3 inches fall? Above the maximum value (1.25 in.) for September! An extraordinary amount of moisture.
Another thing you'll note on the sounding above is that near-surface winds are out of the southeast. This promotes upslope flow--easterly winds forced to rise when they meet the mountains. This constant rising motion in very moist air produces continuous condensation, clouds and rain. You can see how steady the rainfall was last night in looking at this timeseries of observations from the NCAR Foothills lab on the northeast side of Boulder.
The rain gauge reset itself to zero this morning (hence the big drop in precip down to zero again), but you can see that over just last evening over 6 in. of rain had fallen. In one evening. The rainfall was also quite steady over this entire period--no big spurts or jumps in the precipitation that you'd expect if this was due to strong convection. In fact, not much lightning was reported with this rain (though there was some). There have been several reports of particular locations in the foothills getting over 8" of rain so far. This also shows an interesting feature of this event. Remember our precipitable water above? It was only 1.3 inches. If that was the total precipitable water, how could we be getting 6-8 inches of rain? Remember that there is that stream of moisture constantly being brought up on the south--we saw it on the water vapor imagery. This keeps replenishing the water vapor in the atmosphere, bringing in more and more moisture as the current moisture rains out. Still--too get the much rain with these precipitable water values, these clouds have been very efficient at their rain production.
The rainfall overnight consisted of broad areas of stratiform precipitation in some locations, but also (particularly near Boulder) a series of more intense precipitation cells, probably somewhat convective, that repeatedly formed east of town and then moved west over the foothills. Here's an example radar image from last night:
So what are the consequences of so much water over such a short period of time? Flash flooding. Here's the stream gauge data for Boulder Creek at Broadway in downtown Boulder:
There were extreme rises in the stream level overnight. You'll note that the typical river stage is only a little over 1 foot. From 6 PM Wednesday through about 3 AM MDT, the creek rose rapidly to just over 7 feet--moderate flood stage. There was a drop off early this morning as the rain eased a bit, but more rain is developing today and you can see the stream flow on the rise again. Basically all of the canyons along the northern Front Range hit at least minor flood stage last night and into today. Here's the gauge data for St. Vrain Creek near Lyons--approaching record levels. There was also a dam failure last night upstream from Lyons, prompting extensive evacuations.
There continue to be problems with managing this massive amount of water. Pretty much every road going into the mountains is closed due to flooding or mudslides at this time. Many streets in Boulder itself are impassible due to high water. There are evacuations underway in the Big Thompson River canyon (the location of an infamous flood in 1976--which had distinctly different meteorological origin, being due to a parked convective storm as opposed to widespread, more stratiform rain).
Unfortunately it doesn't look like it's time to take a breath just yet. The rain died down a little overnight, but it's forecast to pick up again today. We're already seeing that throughout the region. Here's the latest High-Resolution Rapid Refresh model's forecast for total accumulated precipitation through tonight.
It's predicting another 1-2 inches over the northern Front Range. It's also alarming to note the 3-5 inch accumulations suggested for the mountains behind Colorado Springs and Pueblo, suggesting an additional flash flooding threat further south.
Saturday, October 8, 2011
Heavy rain where it's needed the most
If you remember, during the late summer there was a lot of talk about the wildfires in central and west Texas. That area has been stuck in extreme or exceptional drought conditions for much of this year. Here's the official drought monitor image from NOAA as of October 4th:
You can see that pretty much all of Texas is in some pretty dire straits when it comes to needing rainfall. But it appears that there is some relief in sight. Take a look at the radar composite tonight over central Texas:
A large area of slowly moving, rather heavy rain has planted itself over much of central Texas. There have been some strong wind gusts reported with some of the more intense cores, but no real severe weather. Just lots of heavy rain. I'll update this on Sunday morning with the 24-hour rainfall totals from across central Texas.
So what's helping to cause this rain? Another one of these cut-off lows--like the one that was parked over the midwest and mid-Atlantic states a week ago--has set up over the Rockies, as seen on the 300mb analysis from this evening:
What's interesting about this particular setup is that there doesn't seem to be a strong or organized surface low associated with this upper-level low. A check of the surface map shows that there's an "inverted trough" of low pressure, but really only seems like its there because you have to have a relatively "low" pressure point between the sprawling high over the eastern US (which has brought delightful temperatures to much of the upper midwest) and the high over the northern Rockies today.
I find it somewhat unusual to see the weather pattern more dominated by sprawling high pressure centers as opposed to powerful lows. But, here it is. Notice how as we approach winter the pressure pattern up north is really starting to get intense. A powerful surface low is analyzed over the southeastern tip of Alaska and there's a very tight pressure gradient across northern Ontario and Quebec. Tight pressure gradients imply strong winds, and you can see the cold temperatures up there as well. Soon that sort of stuff will be headed our way...
However, with respect to today's setup, steady southerly and southeasterly winds on the western periphery of the east-coast high are helping to bring lots of relatively deep moisture out of the Gulf of Mexico and into the southern Plains. This 850mb analysis of relative humidity shows a nice plume of moisture from the Gulf up into central Texas.
This moisture is obviously contributing to their heavy rainfall there.
Of course, while this rain is a welcome relief to drought-weary Texans, heavy prolonged rainfall after periods of drought can create flash floods. If the ground is very, very dry it often can't absorb more water at the same rate that the rainfall is dropping water to the ground. The result can be a lot of standing water and runoff into streams. So--even though it's nice to get the rain, Texans should be vigilant for unpredictable flash floods.
You can see that pretty much all of Texas is in some pretty dire straits when it comes to needing rainfall. But it appears that there is some relief in sight. Take a look at the radar composite tonight over central Texas:
A large area of slowly moving, rather heavy rain has planted itself over much of central Texas. There have been some strong wind gusts reported with some of the more intense cores, but no real severe weather. Just lots of heavy rain. I'll update this on Sunday morning with the 24-hour rainfall totals from across central Texas.
So what's helping to cause this rain? Another one of these cut-off lows--like the one that was parked over the midwest and mid-Atlantic states a week ago--has set up over the Rockies, as seen on the 300mb analysis from this evening:
What's interesting about this particular setup is that there doesn't seem to be a strong or organized surface low associated with this upper-level low. A check of the surface map shows that there's an "inverted trough" of low pressure, but really only seems like its there because you have to have a relatively "low" pressure point between the sprawling high over the eastern US (which has brought delightful temperatures to much of the upper midwest) and the high over the northern Rockies today.
However, with respect to today's setup, steady southerly and southeasterly winds on the western periphery of the east-coast high are helping to bring lots of relatively deep moisture out of the Gulf of Mexico and into the southern Plains. This 850mb analysis of relative humidity shows a nice plume of moisture from the Gulf up into central Texas.
This moisture is obviously contributing to their heavy rainfall there.
Of course, while this rain is a welcome relief to drought-weary Texans, heavy prolonged rainfall after periods of drought can create flash floods. If the ground is very, very dry it often can't absorb more water at the same rate that the rainfall is dropping water to the ground. The result can be a lot of standing water and runoff into streams. So--even though it's nice to get the rain, Texans should be vigilant for unpredictable flash floods.
Tuesday, March 29, 2011
Heavy Rain for the Pacific Northwest
We currently have relatively weak flow across the Rocky Mountains and central US, so it's a bad time to be looking for lee-side cyclogenesis. So, in the meantime, I'll turn to more current weather to discuss.
Spring has definitely arrived here in the Pacific Northwest--the trees are blooming, leaves are starting to appear, and high temperatures are consistently in the 50s. However, with spring comes bouts of heavy rain which continue the feel of winter well into June.
The jet stream is on its way north and with it, lots of moisture. Here's the water vapor satellite image from this morning:
That's a lot of upper-level moisture pouring in from the tropics up to Washington and southern British Columbia. It's interesting to note just how long this particular jet streak happens to be--here's the northern hemispheric analysis of 250mb winds from 12Z this morning:
This particular jet streak begins all the way back in eastern China and crosses the entire Pacific before ending over the northwest coast. This sets the stage for a very long-duration rainfall event as moisture is continually advected into the region.
How much rainfall are we looking at? Here is this morning's 24-hour rainfall forecast for the end of the day on Wednesday from the 12km UW WRF model.
The units on these maps are somewhat odd--"cin" stands for "centi-inches" or hundredths of an inch, I believe. Therefore the black colors in the northern and central Cascades that correspond to "256" on the color bar would actually be 2.56 inches--which is a lot. You can really see the orographic enhancement of the precipitation like I talked about in my last blog post. The strongest bands of precipitation are on the windward side of the Cascades and the Bitterroots on the Montana-Idaho border. On the leeward (eastern) side, the precipitation drops off considerably. Also note how dry it is over the northern Puget Sound area. This is a rain shadow behind the Olympic Mountains on the Olympic peninsula. Rain continues through Thursday as well:
You can tell by comparing Thursday's rainfall totals (figure 4) with Wednesday's rainfall totals (figure 3) that the axis of the jet stream is expected to move further north during the time between. Oregon and points further south aren't seeing nearly as much precipitation on Thursday as they did on Wednesday. There's still some black shadings in the North Cascades, though, indicating another 2.5 inches or so on Thursday. That's over 5 inches total, according to these models. Will these amounts verify? The models do tend to over-estimate mountain precipitation in this area, so probably not. But still--quite a bit of water.
Such extended rainfall events being forecast often raises the specter of flooding in the mountain rivers. The Northwest River Forecast Center (NWRFC) runs many hydrologic models using the input from atmospheric models (like the ones we've been looking at) to try and predict how much water will enter each river basin. They can use this information to try and forecast river height. Here's a chart from the NWRFC showing the observed and predicted levels of the Snoqualmie River near the city of Snoqualmie east of Seattle.
On the above chart, the current time (late Tuesday morning) is shown by the vertical purple line. Flood stage is shown by the horizontal red line. You can see that for the past several days river levels have remained relatively constant at around 5 feet. However, with rains expected to begin Tuesday afternoon and continue through Thursday, the level of the river is forecast to rise sharply, peaking around 17 feet on Thursday, which is 4-5 feet above flood stage. However, the river is also forecast to quickly drain out, dropping below flood stage once again by the weekend. I'm curious as to the timing of this rise--I'd expect the peak to occur on Friday or so, after the rain had stopped. Granted, the plot above was made around 9Z this morning, before the new 12Z model data had come in. So maybe this forecast will be amended in the near future. Regardless, flood watches have been posted for a lot of the central and northern Cascades.
It's going to be a wet week in Seattle.
Spring has definitely arrived here in the Pacific Northwest--the trees are blooming, leaves are starting to appear, and high temperatures are consistently in the 50s. However, with spring comes bouts of heavy rain which continue the feel of winter well into June.
The jet stream is on its way north and with it, lots of moisture. Here's the water vapor satellite image from this morning:
![]() |
| Fig 1 -- GOES-W WV satellite image at 17Z, March 29, 2011. From the HOOT website. |
![]() |
| Fig 2 -- 250mb winds (colors) and geopotential height (contours) at 12Z, March 29, 2011. From the HOOT website. |
How much rainfall are we looking at? Here is this morning's 24-hour rainfall forecast for the end of the day on Wednesday from the 12km UW WRF model.
![]() |
| Fig 3 -- Previous 24-hours of rainfall at 00Z, Thursday, March 31, 2011. From the UW Modeling page. |
![]() |
| Fig 4 -- Previous 24-hours of rainfall at 00Z, Friday, April 1, 2011. From the UW Modeling page. |
Such extended rainfall events being forecast often raises the specter of flooding in the mountain rivers. The Northwest River Forecast Center (NWRFC) runs many hydrologic models using the input from atmospheric models (like the ones we've been looking at) to try and predict how much water will enter each river basin. They can use this information to try and forecast river height. Here's a chart from the NWRFC showing the observed and predicted levels of the Snoqualmie River near the city of Snoqualmie east of Seattle.
![]() |
| Fig 5 -- Observed (blue line), model forecast (green line) and extended trend (cyan line) of river stage level for the Snoqualmie River near Snoqualmie, WA. From the NWRFC. |
It's going to be a wet week in Seattle.
Sunday, March 6, 2011
Here comes the flood...
Flooding concerns are going to be big this spring after all of the huge snowfalls we've had in the northern part of the country.
For instance, here's today's watches, warnings and advisories map from the National Weather Service.
We're in between two storm systems in the country at the moment. Up in the northeast we can see advisories associated with the heavy rain and snow from the same trough that brought tornadoes to the southern US over the past few days. Another trough is moving across the intermountain west and when the divergence aloft associated with this feature moves over the eastern slopes of the Rockies, cyclogenesis at the surface is forecast to occur. Cold temperature in the area will bring fairly decent snowfall to the central and northern plains in the next few days. Hence, we're already seeing all the purple winter weather advisories pop up in areas around Wyoming, Nebraska and western Kansas.
But what I wanted to focus on today is the threat of flooding, something that we've been worried about for a few months now given the big snow events we've had in the northern US. There's still a lot of snow on the ground in the northern part of the country, as shown in this National Operational Hydrologic Remote Sensing Center (NOHRSC) analysis from today:
The northeast is gaining snowpack even today with wintry conditions as we saw in the warnings above. But all of the northern plains and upper midwest still have snow on the ground too--over a foot, probably, in much of the northeast and even parts of the upper midwest (the color scale on these images isn't the most high resolution...). If you think about all of the major rivers in the US whose source tributaries lie in the areas that still have snow--the Missouri, the Red River of the North, the Mississippi, even the Ohio River--you can see that there's still a lot of water locked in snow that will be entering the river systems in the coming months.
We can look at snowpack in another way--the ice-water equivalent. If you remember from my discussion on snow ratios, one inch of snow doesn't translate to one inch of liquid water on the ground. Often, one inch of snow is more like a tenth of an inch of liquid water on the ground. Furthermore, as snowpacks age they tend to compress and go through cycles of partial melting and refreezing, all of which complicates the snow-to-liquid conversions even more. There are actually many scientists who study how snowpacks on the ground evolve in time. Such information becomes very important not only for hydrological modeling, but also when we are trying to predict areas where avalanches are likely, figuring out how glaciers are going to evolve, etc. I find it fascinating how much there actually is to say about how snow on the ground changes and evolves.
Anyhow, the NOHRSC has an algorithm to attempt to compute the liquid water equivalent of the snow on the ground, and they produce a product that shows this:
Any areas where you start seeing the brighter pinks mean 6-10 inches of liquid water equivalent contained within the snowpack on the ground. That is, if you melted it all down, there would be 6-10 inches of standing water everywhere. Everywhere. Now all of that is going to be running off into rivers and streams as it melts this spring--yikes.
We're already seeing the effects in some places. Notice that even though Iowa, central Illinois, central Indiana and Ohio have seen a lot of snow this winter, the weather has already warmed up enough so that much of it has melted. There's little to no snow cover in these areas on the maps above. So all the water contained in that area is filling up the rivers. Here's an image showing the current river stages at areas across the central midwest:
The image above shows the current flood stage at various river observing stations in the region. Anything orange, red or purple indicates a river that is at or above minor flood stage (in various degrees of severity). Notice that up north where the snowpack is still on the ground and relatively frozen, all the rivers are still running below flood stage. But move into central and southern Illinois and you see that several rivers, particularly the Illinois River, are experiencing areas of moderate to major flooding from all that snow that has since melted away. It's a similar story if we go east into Indiana and Ohio.
Much of the lower Ohio River is beginning to see some flooding. Other rivers like the White and Wabash Rivers in Indiana are also beginning to see moderate flooding. As areas further upstream keep melting snow, the number of locations seeing flooding will start heading up...
So where will we see flooding next? Every cyclone that moves through brings another wave of melting. A sudden warm spell with rain and thunderstorms on top of snow cover can initiate very fast melting. Any time liquid water mixes with snow, lots of melting begins. So in a radar image like this on the east coast right now:
...we're seeing a lot of rain falling on areas with snow cover still on the ground. Granted, much of the precipitation in far western Pennsylvania, upstate New York and northern New England is falling as snow, so that's just adding to the snowpack. But down in eastern New York, eastern Pennsylvania and the middle Atlantic states, we're just seeing heavy liquid downpours. Recalling in figure 2 above that some of those areas had some decent snow still on the ground, melting is going to occur--and rivers will rise. Here's the NOHRSC's analysis of how much liquid-equivalent of snow has melted in the last 24 hours across the US.
Note there's a wide swath of 1-2 inches of liquid water that as been released due to melting snow in a swath stretching from southern Michigan through southern Ontario and into New York and Pennsylvania. That's a lot of water being released to drain into the river system--particularly since a lot of the tributaries of the Ohio River start up in the western Appalachians of Pennsylvania and New York. So we might expect flooding to translate down the Ohio River Valley. Here's the Hydrometeorological Prediction Center's latest significant river flood outlook between now and Thursday:
They expect significant flooding to continue in the lower Illinois River valley and parts of the Wabash, White and lower Ohio Rivers through Thursday. However, note that they also state that significant flooding is likely or possible in much of southern New York and northern Pennsylvania--right where we're seeing all that rain melting the snow pack today.
Now, just imagine what would happen if we had a storm with a very northerly track that brought a significant warm sector, downpours and thunderstorms to Minnesota and northern Wisconsin where there's a lot of liquid equivalent snowpack still on the ground. All this flooding "potential energy" is just waiting to be released up there. We will have to wait and see how the Mississippi and Red Rivers (of the north) react as snows continue to melt throughout the spring. In the meantime, though, flooding is already happening, so if you live in an area prone to flooding, watch your local forecasts and be prepared.
For instance, here's today's watches, warnings and advisories map from the National Weather Service.
![]() |
| Fig 1 -- NWS watches, warnings and advisories for 2010Z, March 6, 2011. |
But what I wanted to focus on today is the threat of flooding, something that we've been worried about for a few months now given the big snow events we've had in the northern US. There's still a lot of snow on the ground in the northern part of the country, as shown in this National Operational Hydrologic Remote Sensing Center (NOHRSC) analysis from today:
![]() |
| Fig 2 -- Snow depth as of 0600Z, March 6, 2011. From NOHRSC. |
We can look at snowpack in another way--the ice-water equivalent. If you remember from my discussion on snow ratios, one inch of snow doesn't translate to one inch of liquid water on the ground. Often, one inch of snow is more like a tenth of an inch of liquid water on the ground. Furthermore, as snowpacks age they tend to compress and go through cycles of partial melting and refreezing, all of which complicates the snow-to-liquid conversions even more. There are actually many scientists who study how snowpacks on the ground evolve in time. Such information becomes very important not only for hydrological modeling, but also when we are trying to predict areas where avalanches are likely, figuring out how glaciers are going to evolve, etc. I find it fascinating how much there actually is to say about how snow on the ground changes and evolves.
Anyhow, the NOHRSC has an algorithm to attempt to compute the liquid water equivalent of the snow on the ground, and they produce a product that shows this:
![]() |
| Fig 3 -- Snow water equivalent as of 0600Z, March 6, 2011. From NOHRSC. |
We're already seeing the effects in some places. Notice that even though Iowa, central Illinois, central Indiana and Ohio have seen a lot of snow this winter, the weather has already warmed up enough so that much of it has melted. There's little to no snow cover in these areas on the maps above. So all the water contained in that area is filling up the rivers. Here's an image showing the current river stages at areas across the central midwest:
![]() |
| Fig 4 -- River stage conditions as of 2050Z, March 6, 2011. From the North Central River Forecast Center (NOAA). |
![]() |
| Fig 5 -- River stage conditions as of 21Z, March 6, 2011. From the Ohio River Forecast Center (NOAA). |
So where will we see flooding next? Every cyclone that moves through brings another wave of melting. A sudden warm spell with rain and thunderstorms on top of snow cover can initiate very fast melting. Any time liquid water mixes with snow, lots of melting begins. So in a radar image like this on the east coast right now:
![]() |
| Fig 6 -- Base reflectivity radar mosaic over the northeastern US at 2118Z, March 6, 2011. |
![]() |
| Fig 7 -- Previous 24 hours of liquid equivalent snow melt as of 5Z, March 6, 2011. From NOHRSC. |
![]() |
| Fig 8 -- HPC Significant River Flood Outlook valid through Thursday, March 10, 2011 and issued on Saturday, March 5, 2011 at 2034Z. From the HPC. |
Now, just imagine what would happen if we had a storm with a very northerly track that brought a significant warm sector, downpours and thunderstorms to Minnesota and northern Wisconsin where there's a lot of liquid equivalent snowpack still on the ground. All this flooding "potential energy" is just waiting to be released up there. We will have to wait and see how the Mississippi and Red Rivers (of the north) react as snows continue to melt throughout the spring. In the meantime, though, flooding is already happening, so if you live in an area prone to flooding, watch your local forecasts and be prepared.
Subscribe to:
Posts (Atom)