

In the top panel you're seeing the daily temperature ranges as the dark blue bars, then in the background are the normal daily range (light green) stretching out to record highs (the light red) and record lows (light blue). While bouncing around a bit, the temperatures in Chicago actually have been pretty near normal overall, with cold spells in early January and early February and a warm spell in mid-late January. The next plot down is the precipitation so far this year in inches and the plot below that is the snowfall so far in inches. The yellow lines in both plots are the "normal" precipitation up to that point in the year. Now, precipitation doesn't smoothly fall in even amounts every day, so we never expect the actual precipitation to look like that. Instead, it tends to follow a stair-step pattern, jumping every time there's a big event. Anywhere you see dark green, the precipitation at that point was greater than the normal for the year at that time.
Here's what's interesting about the plots above. You can see in the bottom panel that the total snowfall since January 1st is at 33.8 inches--almost 250% of normal. The big snowstorm of January 31-February 2 shows up quite starkly as the abrupt jump in the snowfall. But what about the actual liquid precipitation? In the panel above, you can see that this is still right about normal: we've had 2.44 inches so far this year. So, despite having extreme snow depth amounts, the actual liquid content of that snow wasn't anything to go on about. It must have been extremely fluffy snow.
In fact, you can estimate the snow ratio from the last event. Looks like the total gain in snowfall was 20 inches of snow (~14 inches to 33.8 inches) but the gain in precipitation was only about 1 inch (adding up the daily observations). So the snow ratio was around 20:1---twice as big as the commonly-assumed 10:1 snow ratio we use as a ballpark figure.
The Boston forecast office doesn't seem to have nice plots like the one I showed above (in fact, most of the climatology data on the website seems to not have been updated since 2002 or, in some cases, since 1995 (!)). From the climate data, though, in January KBOS had 34.4 inches of snow (compared to a normal of 12.9 inches). For liquid precipitation, they had 3.57 inches compared to a normal of 3.36 inches. So, despite having over 250% of the normal snowfall, there was only slightly more liquid equivalent than normal. The snow ratios were lower--about 10:1--but that seems to be more usual for Boston. Regardless, incredible snow depth totals doesn't mean incredible snow liquid totals. Thinking down the line, this means that when the spring melt-out time comes, these heavy snowfalls don't portend any unusual flooding...
In fact, the January precipitation was near normal for most of the areas hit hard by snow, according to the Climate Prediction Center.
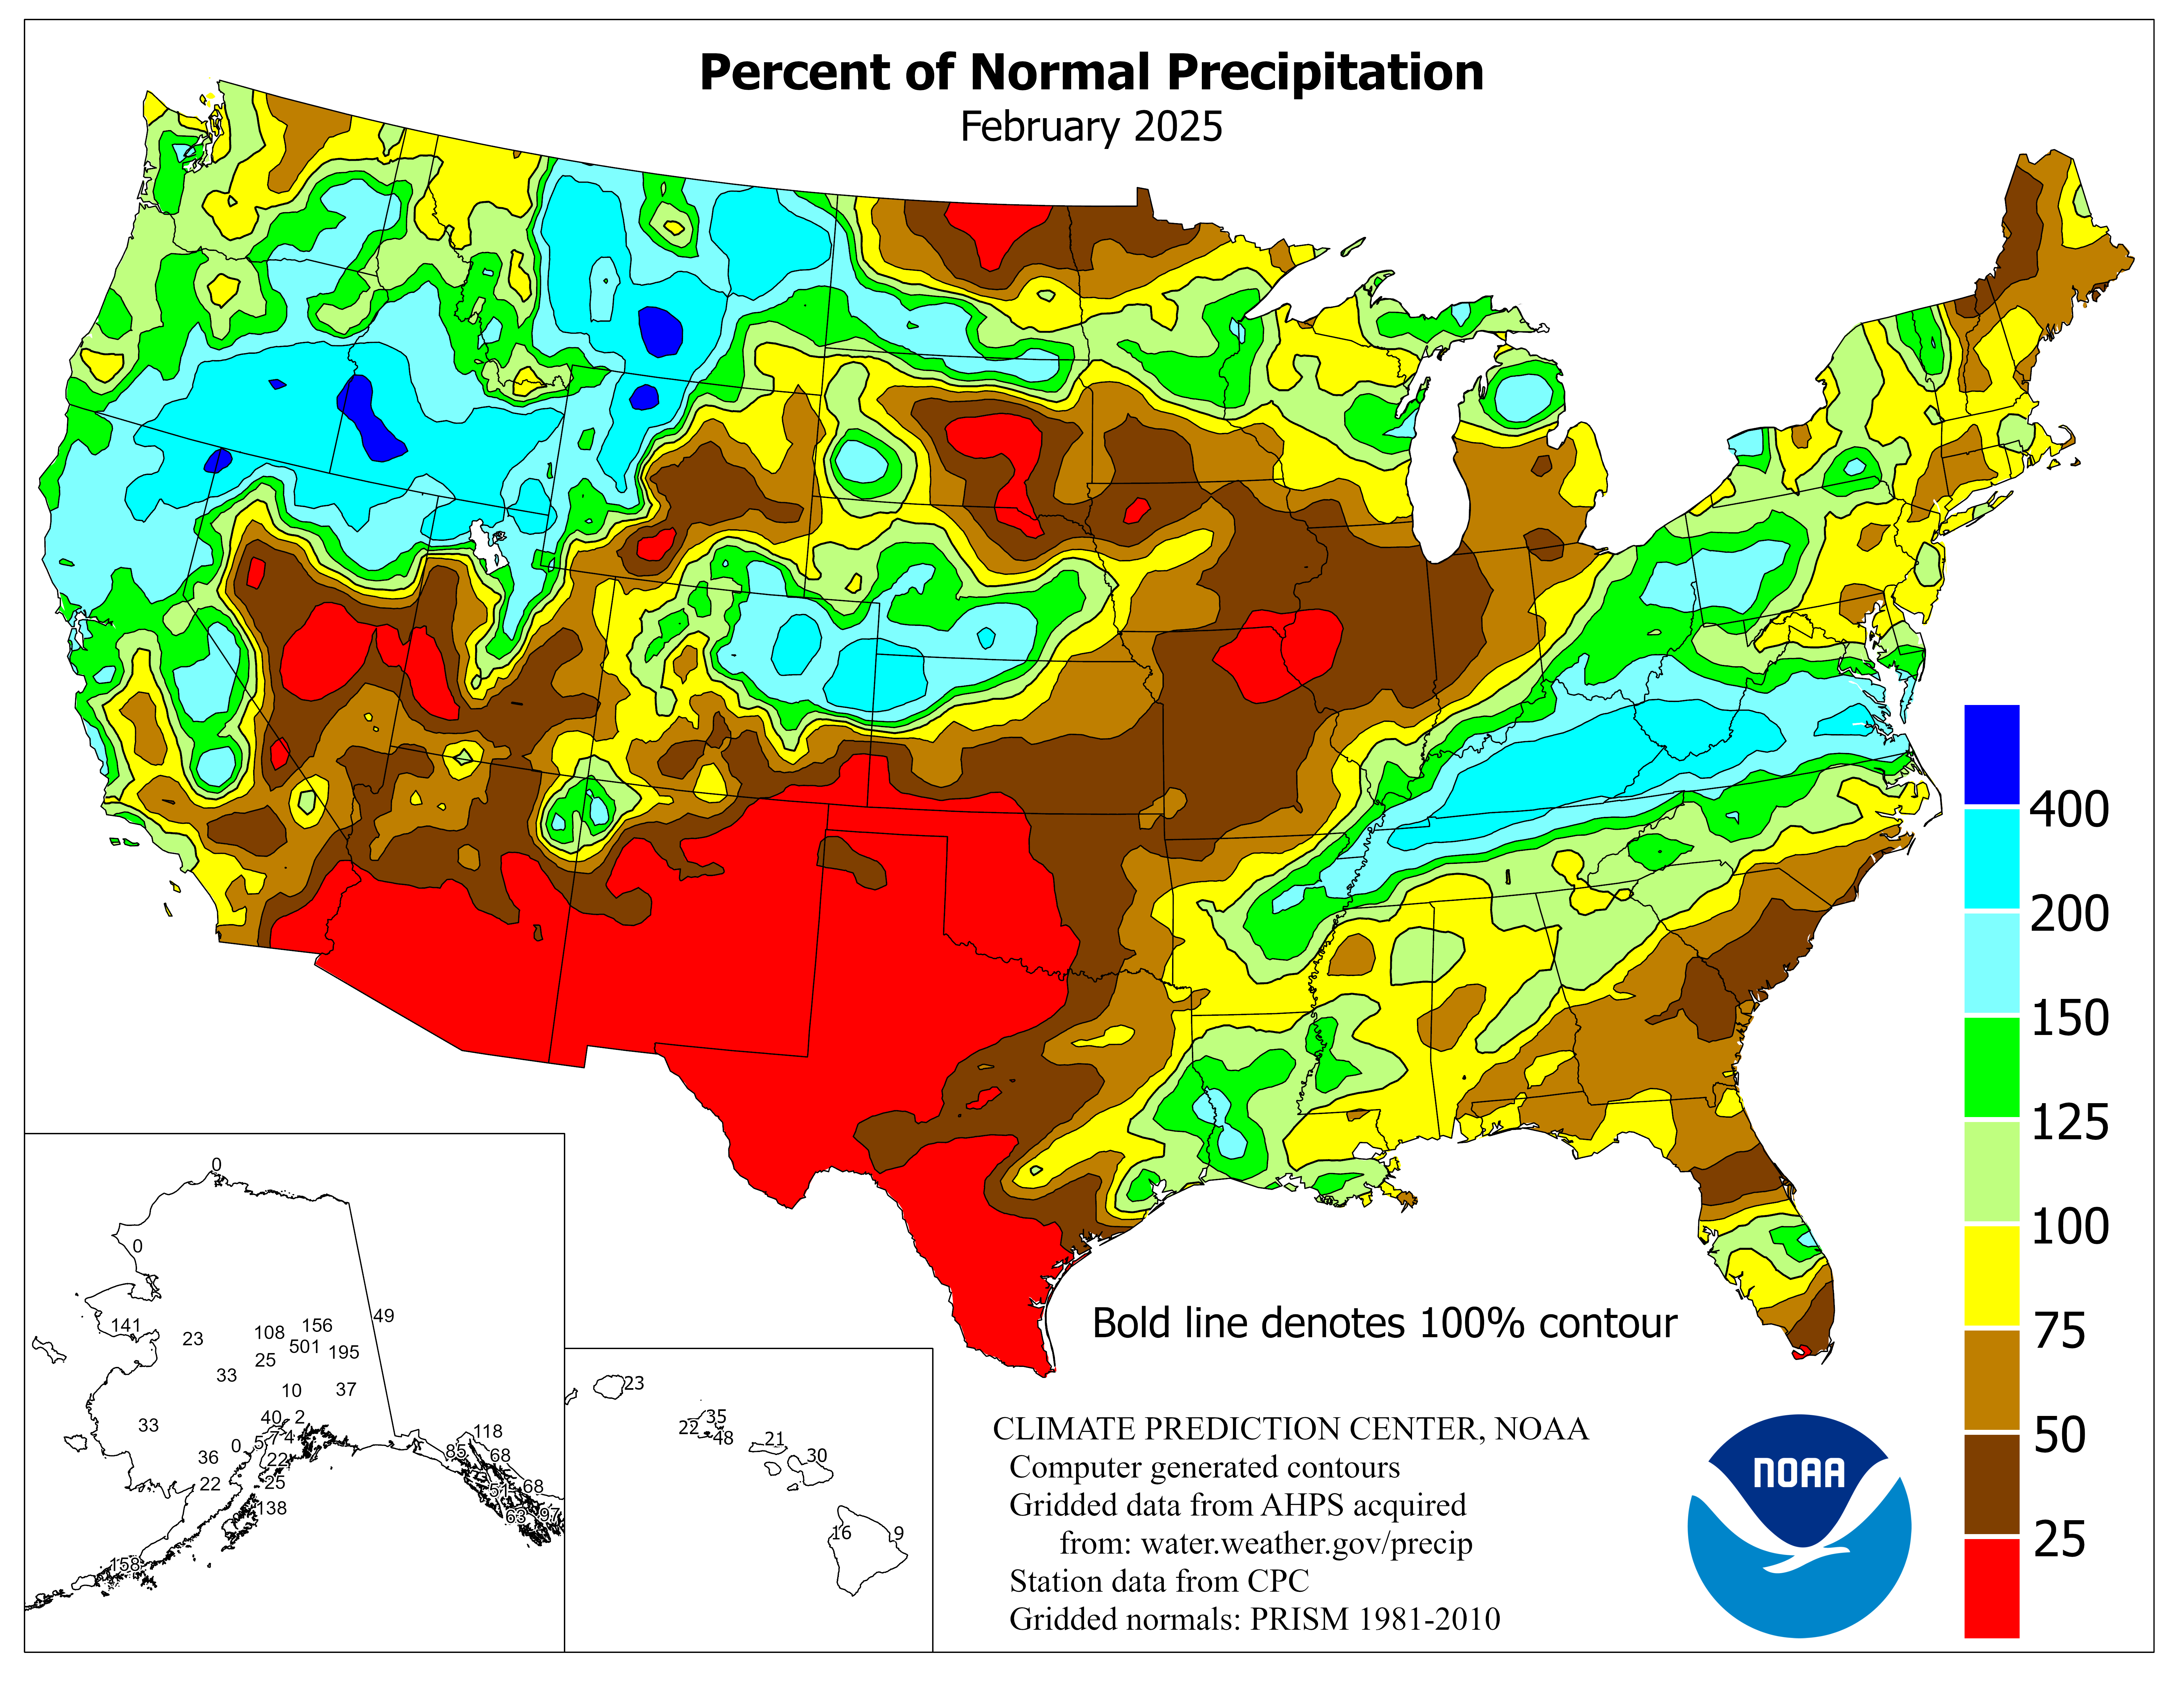
The two areas that stand out, though, are the continued drought in much of the western US (particularly California) and the wetter-than-normal conditions in Arizona through west Texas that were caused by a few cut-off lows that brought a lot of moisture to that region. The effects of these anomalies will be watched in the coming months.
No comments:
Post a Comment